Wells Fargo 2011 Annual Report Download - page 64
Download and view the complete annual report
Please find page 64 of the 2011 Wells Fargo annual report below. You can navigate through the pages in the report by either clicking on the pages listed below, or by using the keyword search tool below to find specific information within the annual report.-
 1
1 -
2
-
3
-
4
-
5
-
6
-
7
-
8
-
9
-
10
-
11
-
12
-
13
-
14
-
15
-
16
-
17
-
18
-
19
-
20
-
21
-
22
-
23
-
24
-
25
-
26
-
27
-
28
-
29
-
30
-
31
-
32
-
33
-
34
-
35
-
36
-
37
-
38
-
39
-
40
-
41
-
42
-
43
-
44
-
45
-
46
-
47
-
48
-
49
-
50
-
51
-
52
-
53
-
 54
54 -
 55
55 -
 56
56 -
 57
57 -
 58
58 -
 59
59 -
 60
60 -
 61
61 -
 62
62 -
 63
63 -
 64
64 -
 65
65 -
 66
66 -
 67
67 -
 68
68 -
 69
69 -
 70
70 -
 71
71 -
 72
72 -
 73
73 -
 74
74 -
75
-
76
-
77
-
78
-
79
-
80
-
81
-
82
-
83
-
84
-
85
-
86
-
87
-
88
-
89
-
90
-
91
-
92
-
93
-
94
-
95
-
96
-
97
-
98
-
99
-
100
-
101
-
102
-
103
-
104
-
105
-
106
-
107
-
108
-
109
-
110
-
111
-
112
-
113
-
114
-
115
-
116
-
117
-
118
-
119
-
120
-
121
-
122
-
123
-
124
-
125
-
126
-
127
-
128
-
129
-
130
-
131
-
132
-
133
-
134
-
135
-
136
-
137
-
138
-
139
-
140
-
141
-
142
-
143
-
144
-
145
-
146
-
147
-
148
-
149
-
150
-
151
-
152
-
153
-
154
-
155
-
156
-
157
-
158
-
159
-
160
-
161
-
162
-
163
-
164
-
165
-
166
-
167
-
168
-
169
-
170
-
171
-
172
-
173
-
174
-
175
-
176
-
177
-
178
-
179
-
180
-
181
-
182
-
183
-
184
-
185
-
186
-
187
-
188
-
189
-
190
-
191
-
192
-
193
-
194
-
195
-
196
-
197
-
198
-
199
-
200
-
201
-
202
-
203
-
204
-
205
-
206
-
207
-
208
-
209
-
210
-
211
-
212
-
213
-
214
-
215
-
216
-
217
-
218
-
219
-
220
-
221
-
222
-
223
-
224
-
225
-
226
-
227
-
228
-
229
-
230
-
231
-
232
-
233
-
234
-
235
-
236
-
237
-
238
-
239
-
240
 |
 |

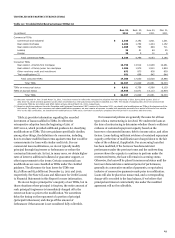
Risk Management — Credit Risk Management (continued)
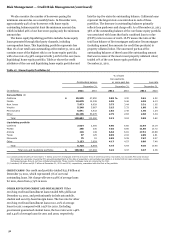
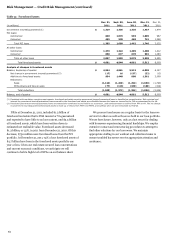
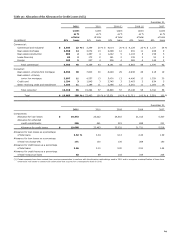
Table 31: Foreclosed Assets
Dec. 31,
Sept. 30,
June 30,
Mar. 31,
Dec. 31,
(in millions)
2011
2011
2011
2011
2010
Government insured/guaranteed (1)
$
1,319
1,336
1,320
1,457
1,479
PCI loans:
Commercial
840
1,079
993
1,005
967
Consumer
465
530
469
741
1,068
Total PCI loans
1,305
1,609
1,462
1,746
2,035
All other loans:
Commercial
1,379
1,322
1,409
1,408
1,412
Consumer
658
677
670
901
1,083
Total all other loans
2,037
1,999
2,079
2,309
2,495
Total foreclosed assets
$
4,661
4,944
4,861
5,512
6,009
Analysis of changes in foreclosed assets
Balance, beginning of quarter
$
4,944
4,861
5,512
6,009
6,127
Net change in government insured/guaranteed (2)
(17)
16
(137)
(22)
(13)
Additions to foreclosed assets
934
1,440
880
1,361
2,099
Reductions:
Sales
(1,123)
(1,260)
(1,294)
(1,656)
(1,790)
Write-downs and loss on sales
(77)
(113)
(100)
(180)
(414)
Total reductions
(1,200)
(1,373)
(1,394)
(1,836)
(2,204)
Balance, end of quarter
$
4,661
4,944
4,861
5,512
6,009
(1)
Consistent with regulatory reporting requirements, foreclosed real estate securing government insured/guaranteed loans is classified as nonperforming. Both principal and
interest for government insured/guaranteed loans secured by the foreclosed real estate are collectible because the loans are insured by the FHA or guaranteed by the VA.
(2)
Foreclosed government insured/guaranteed loans are temporarily transferred to and held by us as servicer, until reimbursement is received from FHA or VA. The net change
in government insured/guaranteed foreclosed assets is made up of inflows from MHFI and MHFS, and outflows when we are reimbursed by FHA/VA.
NPAs at December 31, 2011, included $1.3 billion of
foreclosed real estate that is FHA insured or VA guaranteed
and expected to have little to no loss content, and $3.3 billion
of foreclosed assets, which have been written down to
estimated net realizable value. Foreclosed assets decreased
$1.3 billion, or 22%, in 2011 from December 31, 2010. Of this
decrease, $730 million were foreclosed loans from the PCI
portfolio. At December 31, 2011, 74% of our foreclosed assets of
$4.7 billion have been in the foreclosed assets portfolio one
year or less. Given our real estate-secured loan concentrations
and current economic conditions, we anticipate we will
continue to hold a high level of NPAs on our balance sheet.
We process foreclosures on a regular basis for the loans we
service for others as well as those we hold in our loan portfolio.
We use foreclosure, however, only as a last resort for dealing
with borrowers experiencing financial hardships. We employ
extensive contact and restructuring procedures to attempt to
find other solutions for our borrowers. We maintain
appropriate staffing in our workout and collection teams to
ensure troubled borrowers receive appropriate attention and
assistance.
62