Wells Fargo 2011 Annual Report Download - page 73
Download and view the complete annual report
Please find page 73 of the 2011 Wells Fargo annual report below. You can navigate through the pages in the report by either clicking on the pages listed below, or by using the keyword search tool below to find specific information within the annual report.-
 1
1 -
2
-
3
-
4
-
5
-
6
-
7
-
8
-
9
-
10
-
11
-
12
-
13
-
14
-
15
-
16
-
17
-
18
-
19
-
20
-
21
-
22
-
23
-
24
-
25
-
26
-
27
-
28
-
29
-
30
-
31
-
32
-
33
-
34
-
35
-
36
-
37
-
38
-
39
-
40
-
41
-
42
-
43
-
44
-
45
-
46
-
47
-
48
-
49
-
50
-
51
-
52
-
53
-
54
-
55
-
56
-
57
-
58
-
59
-
60
-
61
-
62
-
 63
63 -
 64
64 -
 65
65 -
 66
66 -
 67
67 -
 68
68 -
 69
69 -
 70
70 -
 71
71 -
 72
72 -
 73
73 -
 74
74 -
 75
75 -
 76
76 -
 77
77 -
 78
78 -
 79
79 -
 80
80 -
 81
81 -
 82
82 -
 83
83 -
84
-
85
-
86
-
87
-
88
-
89
-
90
-
91
-
92
-
93
-
94
-
95
-
96
-
97
-
98
-
99
-
100
-
101
-
102
-
103
-
104
-
105
-
106
-
107
-
108
-
109
-
110
-
111
-
112
-
113
-
114
-
115
-
116
-
117
-
118
-
119
-
120
-
121
-
122
-
123
-
124
-
125
-
126
-
127
-
128
-
129
-
130
-
131
-
132
-
133
-
134
-
135
-
136
-
137
-
138
-
139
-
140
-
141
-
142
-
143
-
144
-
145
-
146
-
147
-
148
-
149
-
150
-
151
-
152
-
153
-
154
-
155
-
156
-
157
-
158
-
159
-
160
-
161
-
162
-
163
-
164
-
165
-
166
-
167
-
168
-
169
-
170
-
171
-
172
-
173
-
174
-
175
-
176
-
177
-
178
-
179
-
180
-
181
-
182
-
183
-
184
-
185
-
186
-
187
-
188
-
189
-
190
-
191
-
192
-
193
-
194
-
195
-
196
-
197
-
198
-
199
-
200
-
201
-
202
-
203
-
204
-
205
-
206
-
207
-
208
-
209
-
210
-
211
-
212
-
213
-
214
-
215
-
216
-
217
-
218
-
219
-
220
-
221
-
222
-
223
-
224
-
225
-
226
-
227
-
228
-
229
-
230
-
231
-
232
-
233
-
234
-
235
-
236
-
237
-
238
-
239
-
240
 |
 |
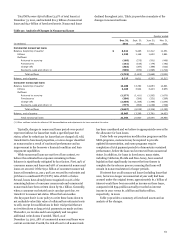
The level of repurchase demands outstanding at
December 31, 2011, was down from a year ago in both number of
outstanding loans and in total dollar balances as we continued to
work through the demands. Customary with industry practice,
we have the right of recourse against correspondent lenders from
whom we have purchased loans with respect to representations
and warranties. Of total repurchase demands and mortgage
insurance recissions outstanding as of December 31, 2011,
presented in Table 37, approximately 20% relate to loans
purchased from correspondent lenders. Due primarily to the
financial difficulties of some correspondent lenders, we typically
recover on average approximately 50% of losses from these
lenders. Historical recovery rates as well as projected lender
performance are incorporated in the establishment of our
mortgage repurchase liability.
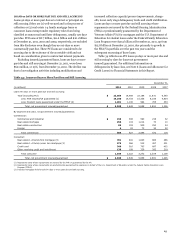
Our liability for repurchases, included in “Accrued expenses
and other liabilities” in our consolidated financial statements,
was $1.3 billion at both December 31, 2011 and 2010. In 2011
$1.3 billion of additions to the liability were recorded, which
reduced net gains on mortgage loan origination/sales activities,
compared with $1.6 billion in 2010. Our additions to the
repurchase liability in 2011 and 2010 predominately reflect
updated assumptions about probable future demands on prior
vintages. This increase in our estimate for probable future
demands in 2011 was primarily due to an increase in repurchase
demands from the GSEs on the 2006-2008 vintages with a
higher than anticipated increase from the Federal National
Mortgage Association (FNMA) in the latter half of 2011.
We believe we have a high quality residential mortgage loan
servicing portfolio. Of the $1.8 trillion in the residential
mortgage loan servicing portfolio at December 31, 2011, 92% was
current, less than 2% was subprime at origination, and less than
1% was home equity securitizations. Our combined delinquency
and foreclosure rate on this portfolio was 7.96% at
December 31, 2011, compared with 8.02% at December 31, 2010.
In this portfolio 5% are private label securitizations where we
originated the loan and therefore have some repurchase risk. We
believe the risk of repurchase in our private label securitizations
is substantially reduced, relative to other private label
securitizations, because approximately half of this portfolio of
private label securitizations that include our mortgage loans do
not contain representations and warranties regarding borrower
or other third party misrepresentations related to the mortgage
loan, general compliance with underwriting guidelines, or
property valuation, which are commonly asserted bases for
repurchase. For this 5% private label securitization segment of
our residential mortgage loan servicing portfolio, 58% are loans
from 2005 vintages or earlier (weighted average age of
75 months); 79% were prime at origination; and approximately
66% are jumbo loans. The weighted-average LTV as of
December 31, 2011, for this private securitization segment was
78%. We believe the highest risk segment of these private label
securitizations is the subprime loans originated in 2006 and
2007. These subprime loans have seller representations and
warranties and currently have LTVs close to or exceeding 100%,
and represent 9% of the 5% private label securitization portion of
the residential mortgage servicing portfolio. We had only
$110 million of repurchases related to private label
securitizations in 2011. Of the servicing portfolio, 4% is non-
agency acquired servicing and 2% is private whole loan sales. We
did not underwrite and securitize the non-agency acquired
servicing and therefore we have no obligation on that portion of
our servicing portfolio to the investor for any repurchase
demands arising from origination practices. For the private
whole loan segment, while we do have repurchase risk on these
prior loan sales, less than 2% were subprime at origination and
loans that were sold and subsequently securitized are included in
the private label securitization segment discussed above.
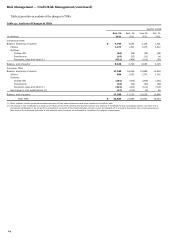
Table 38 summarizes the changes in our mortgage
repurchase liability.
71