Wells Fargo 2011 Annual Report Download - page 226
Download and view the complete annual report
Please find page 226 of the 2011 Wells Fargo annual report below. You can navigate through the pages in the report by either clicking on the pages listed below, or by using the keyword search tool below to find specific information within the annual report.-
 1
1 -
2
-
3
-
4
-
5
-
6
-
7
-
8
-
9
-
10
-
11
-
12
-
13
-
14
-
15
-
16
-
17
-
18
-
19
-
20
-
21
-
22
-
23
-
24
-
25
-
26
-
27
-
28
-
29
-
30
-
31
-
32
-
33
-
34
-
35
-
36
-
37
-
38
-
39
-
40
-
41
-
42
-
43
-
44
-
45
-
46
-
47
-
48
-
49
-
50
-
51
-
52
-
53
-
54
-
55
-
56
-
57
-
58
-
59
-
60
-
61
-
62
-
63
-
64
-
65
-
66
-
67
-
68
-
69
-
70
-
71
-
72
-
73
-
74
-
75
-
76
-
77
-
78
-
79
-
80
-
81
-
82
-
83
-
84
-
85
-
86
-
87
-
88
-
89
-
90
-
91
-
92
-
93
-
94
-
95
-
96
-
97
-
98
-
99
-
100
-
101
-
102
-
103
-
104
-
105
-
106
-
107
-
108
-
109
-
110
-
111
-
112
-
113
-
114
-
115
-
116
-
117
-
118
-
119
-
120
-
121
-
122
-
123
-
124
-
125
-
126
-
127
-
128
-
129
-
130
-
131
-
132
-
133
-
134
-
135
-
136
-
137
-
138
-
139
-
140
-
141
-
142
-
143
-
144
-
145
-
146
-
147
-
148
-
149
-
150
-
151
-
152
-
153
-
154
-
155
-
156
-
157
-
158
-
159
-
160
-
161
-
162
-
163
-
164
-
165
-
166
-
167
-
168
-
169
-
170
-
171
-
172
-
173
-
174
-
175
-
176
-
177
-
178
-
179
-
180
-
181
-
182
-
183
-
184
-
185
-
186
-
187
-
188
-
189
-
190
-
191
-
192
-
193
-
194
-
195
-
196
-
197
-
198
-
199
-
200
-
201
-
202
-
203
-
204
-
205
-
206
-
207
-
208
-
209
-
210
-
211
-
212
-
213
-
214
-
215
-
 216
216 -
 217
217 -
 218
218 -
 219
219 -
 220
220 -
 221
221 -
 222
222 -
 223
223 -
 224
224 -
 225
225 -
 226
226 -
 227
227 -
 228
228 -
 229
229 -
 230
230 -
 231
231 -
 232
232 -
 233
233 -
 234
234 -
 235
235 -
 236
236 -
237
-
238
-
239
-
240
 |
 |

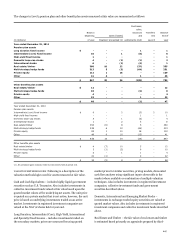
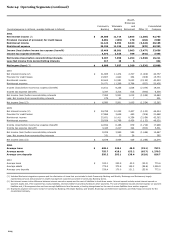
Note 24: Operating Segments (continued)
Wealth,
Brokerage
Community
Wholesale
and
Consolidated
(income/expense in millions, average balances in billions)
Banking
Banking
Retirement
Other (1)
Company
2011
Net interest income (2)
$
29,580
11,714
2,855
(1,386)
42,763
Provision (reversal of provision) for credit losses
8,001
(109)
170
(163)
7,899
Noninterest income
21,124
9,952
9,333
(2,224)
38,185
Noninterest expense
29,234
11,194
9,935
(970)
49,393
Income (loss) before income tax expense (benefit)
13,469
10,581
2,083
(2,477)
23,656
Income tax expense (benefit)
4,072
3,525
789
(941)
7,445
Net income (loss) before noncontrolling interests
9,397
7,056
1,294
(1,536)
16,211
Less: Net income from noncontrolling interests
317
19
6
-
342
Net income (loss) (3)
$
9,080
7,037
1,288
(1,536)
15,869
2010
Net interest income (2)
$
31,885
11,474
2,707
(1,309)
44,757
Provision for credit losses
13,807
1,920
334
(308)
15,753
Noninterest income
22,604
10,951
9,023
(2,125)
40,453
Noninterest expense
30,071
11,269
9,768
(652)
50,456
Income (loss) before income tax expense (benefit)
10,611
9,236
1,628
(2,474)
19,001
Income tax expense (benefit)
3,347
3,315
616
(940)
6,338
Net income (loss) before noncontrolling interests
7,264
5,921
1,012
(1,534)
12,663
Less: Net income from noncontrolling interests
274
20
7
-
301
Net income (loss) (3)
$
6,990
5,901
1,005
(1,534)
12,362
2009
Net interest income (2)
$
34,795
10,222
2,407
(1,100)
46,324
Provision for credit losses
17,866
3,648
460
(306)
21,668
Noninterest income
25,651
10,411
8,358
(2,058)
42,362
Noninterest expense
29,928
10,799
9,426
(1,133)
49,020
Income (loss) before income tax expense (benefit)
12,652
6,186
879
(1,719)
17,998
Income tax expense (benefit)
3,443
2,217
324
(653)
5,331
Net income (loss) before noncontrolling interests
9,209
3,969
555
(1,066)
12,667
Less: Net income from noncontrolling interests
331
35
26
-
392
Net income (loss) (3)
$
8,878
3,934
529
(1,066)
12,275
2011
Average loans
$
498.1
249.1
43.0
(33.1)
757.1
Average assets
755.7
428.1
152.2
(65.7)
1,270.3
Average core deposits
556.2
202.1
130.4
(62.0)
826.7
2010
Average loans
$
530.1
230.5
43.0
(33.0)
770.6
Average assets
772.4
373.8
139.3
(58.6)
1,226.9
Average core deposits
536.4
170.0
121.2
(55.6)
772.0
(1) Includes Wachovia integration expenses and the elimination of items that are included in both Community Banking and Wealth, Brokerage and Retirement, largely
representing services and products for wealth management customers provided in Community Banking stores.
(2) Net interest income is the difference between interest earned on assets and the cost of liabilities to fund those assets. Interest earned includes actual interest earned on
segment assets and, if the segment has excess liabilities, interest credits for providing funding to other segments. The cost of liabilities includes interest expense on segment
liabilities and, if the segment does not have enough liabilities to fund its assets, a funding charge based on the cost of excess liabilities from another segment.
(3) Represents segment net income (loss) for Community Banking; Wholesale Banking; and Wealth, Brokerage and Retirement segments and Wells Fargo net income for the
consolidated company.
224