Wells Fargo 2011 Annual Report Download - page 52
Download and view the complete annual report
Please find page 52 of the 2011 Wells Fargo annual report below. You can navigate through the pages in the report by either clicking on the pages listed below, or by using the keyword search tool below to find specific information within the annual report.-
 1
1 -
2
-
3
-
4
-
5
-
6
-
7
-
8
-
9
-
10
-
11
-
12
-
13
-
14
-
15
-
16
-
17
-
18
-
19
-
20
-
21
-
22
-
23
-
24
-
25
-
26
-
27
-
28
-
29
-
30
-
31
-
32
-
33
-
34
-
35
-
36
-
37
-
38
-
39
-
40
-
41
-
 42
42 -
 43
43 -
 44
44 -
 45
45 -
 46
46 -
 47
47 -
 48
48 -
 49
49 -
 50
50 -
 51
51 -
 52
52 -
 53
53 -
 54
54 -
 55
55 -
 56
56 -
 57
57 -
 58
58 -
 59
59 -
 60
60 -
 61
61 -
 62
62 -
63
-
64
-
65
-
66
-
67
-
68
-
69
-
70
-
71
-
72
-
73
-
74
-
75
-
76
-
77
-
78
-
79
-
80
-
81
-
82
-
83
-
84
-
85
-
86
-
87
-
88
-
89
-
90
-
91
-
92
-
93
-
94
-
95
-
96
-
97
-
98
-
99
-
100
-
101
-
102
-
103
-
104
-
105
-
106
-
107
-
108
-
109
-
110
-
111
-
112
-
113
-
114
-
115
-
116
-
117
-
118
-
119
-
120
-
121
-
122
-
123
-
124
-
125
-
126
-
127
-
128
-
129
-
130
-
131
-
132
-
133
-
134
-
135
-
136
-
137
-
138
-
139
-
140
-
141
-
142
-
143
-
144
-
145
-
146
-
147
-
148
-
149
-
150
-
151
-
152
-
153
-
154
-
155
-
156
-
157
-
158
-
159
-
160
-
161
-
162
-
163
-
164
-
165
-
166
-
167
-
168
-
169
-
170
-
171
-
172
-
173
-
174
-
175
-
176
-
177
-
178
-
179
-
180
-
181
-
182
-
183
-
184
-
185
-
186
-
187
-
188
-
189
-
190
-
191
-
192
-
193
-
194
-
195
-
196
-
197
-
198
-
199
-
200
-
201
-
202
-
203
-
204
-
205
-
206
-
207
-
208
-
209
-
210
-
211
-
212
-
213
-
214
-
215
-
216
-
217
-
218
-
219
-
220
-
221
-
222
-
223
-
224
-
225
-
226
-
227
-
228
-
229
-
230
-
231
-
232
-
233
-
234
-
235
-
236
-
237
-
238
-
239
-
240
 |
 |

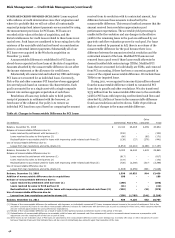
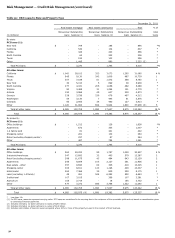
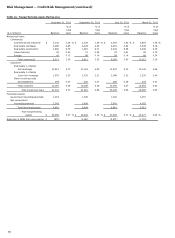
Risk Management — Credit Risk Management (continued)
Table 20: CRE Loans by State and Property Type
December 31, 2011
Real estate mortgage
Real estate construction
Total
% of
Nonaccrual
Outstanding
Nonaccrual
Outstanding
Nonaccrual
Outstanding
total
(in millions)
loans
balance (1)
loans
balance (1)
loans
balance (1)
loans
By state:
PCI loans (1):
New York
$
-
709
-
186
-
895
*
%
California
-
533
-
104
-
637
*
Florida
-
326
-
230
-
556
*
North Carolina
-
64
-
242
-
306
*
Texas
-
193
-
103
-
296
*
Other
-
1,445
-
880
-
2,325
(2)
*
Total PCI loans
$
-
3,270
-
1,745
-
5,015
*
%
All other loans:
California
$
1,042
28,012
323
3,073
1,365
31,085
4
%
Florida
645
9,130
242
1,609
887
10,739
1
Texas
307
7,188
61
1,572
368
8,760
1
New York
33
5,010
5
899
38
5,909
*
North Carolina
277
4,331
205
1,058
482
5,389
*
Virginia
90
3,485
31
1,294
121
4,779
*
Arizona
190
3,966
49
607
239
4,573
*
Georgia
228
3,536
239
676
467
4,212
*
Washington
54
3,130
7
445
61
3,575
*
Colorado
93
2,953
34
460
127
3,413
*
Other
1,126
31,964
694
5,944
1,820
37,908
(3)
5
Total all other loans
$
4,085
102,705
1,890
17,637
5,975
120,342
16
%
Total
$
4,085
105,975
1,890
19,382
5,975
125,357
16
%
By property:
PCI loans (1):
Office buildings
$
-
1,512
-
126
-
1,638
*
%
Apartments
-
672
-
335
-
1,007
*
1-4 family land
-
81
-
341
-
422
*
Shopping center
-
261
-
102
-
363
*
Retail (excluding shopping center)
-
257
-
87
-
344
*
Other
-
487
-
754
-
1,241
*
Total PCI loans
$
-
3,270
-
1,745
-
5,015
*
%
All other loans:
Office buildings
$
960
29,200
99
1,757
1,059
30,957
4
%
Industrial/warehouse
547
12,892
32
495
579
13,387
2
Retail (excluding shopping center)
598
11,675
45
484
643
12,159
2
Apartments
256
9,809
105
2,127
361
11,936
2
Real estate - other
357
9,690
62
335
419
10,025
1
Shopping center
306
8,811
123
1,196
429
10,007
1
Hotel/motel
264
7,366
35
809
299
8,175
1
Land (excluding 1-4 family)
48
261
544
6,382
592
6,643
*
Institutional
107
3,015
-
266
107
3,281
*
Agriculture
165
2,714
-
18
165
2,732
*
Other
477
7,272
845
3,768
1,322
11,040
1
Total all other loans
$
4,085
102,705
1,890
17,637
5,975
120,342
16
%
Total
$
4,085
105,975
(4)
1,890
19,382
5,975
125,357
16
%
* Less than 1%.
(1) For PCI loans, amounts represent carrying value. PCI loans are considered to be accruing due to the existence of the accretable yield and not based on consideration given
to contractual interest payments.
(2) Includes 33 states; no state had loans in excess of $284 million.
(3) Includes 40 states; no state had loans in excess of $3.0 billion.
(4) Includes $34.9 billion of loans to owner-occupants where 51% or more of the property is used in the conduct of their business.
50