Wells Fargo 2011 Annual Report Download - page 55
Download and view the complete annual report
Please find page 55 of the 2011 Wells Fargo annual report below. You can navigate through the pages in the report by either clicking on the pages listed below, or by using the keyword search tool below to find specific information within the annual report.-
 1
1 -
2
-
3
-
4
-
5
-
6
-
7
-
8
-
9
-
10
-
11
-
12
-
13
-
14
-
15
-
16
-
17
-
18
-
19
-
20
-
21
-
22
-
23
-
24
-
25
-
26
-
27
-
28
-
29
-
30
-
31
-
32
-
33
-
34
-
35
-
36
-
37
-
38
-
39
-
40
-
41
-
42
-
43
-
44
-
 45
45 -
 46
46 -
 47
47 -
 48
48 -
 49
49 -
 50
50 -
 51
51 -
 52
52 -
 53
53 -
 54
54 -
 55
55 -
 56
56 -
 57
57 -
 58
58 -
 59
59 -
 60
60 -
 61
61 -
 62
62 -
 63
63 -
 64
64 -
 65
65 -
66
-
67
-
68
-
69
-
70
-
71
-
72
-
73
-
74
-
75
-
76
-
77
-
78
-
79
-
80
-
81
-
82
-
83
-
84
-
85
-
86
-
87
-
88
-
89
-
90
-
91
-
92
-
93
-
94
-
95
-
96
-
97
-
98
-
99
-
100
-
101
-
102
-
103
-
104
-
105
-
106
-
107
-
108
-
109
-
110
-
111
-
112
-
113
-
114
-
115
-
116
-
117
-
118
-
119
-
120
-
121
-
122
-
123
-
124
-
125
-
126
-
127
-
128
-
129
-
130
-
131
-
132
-
133
-
134
-
135
-
136
-
137
-
138
-
139
-
140
-
141
-
142
-
143
-
144
-
145
-
146
-
147
-
148
-
149
-
150
-
151
-
152
-
153
-
154
-
155
-
156
-
157
-
158
-
159
-
160
-
161
-
162
-
163
-
164
-
165
-
166
-
167
-
168
-
169
-
170
-
171
-
172
-
173
-
174
-
175
-
176
-
177
-
178
-
179
-
180
-
181
-
182
-
183
-
184
-
185
-
186
-
187
-
188
-
189
-
190
-
191
-
192
-
193
-
194
-
195
-
196
-
197
-
198
-
199
-
200
-
201
-
202
-
203
-
204
-
205
-
206
-
207
-
208
-
209
-
210
-
211
-
212
-
213
-
214
-
215
-
216
-
217
-
218
-
219
-
220
-
221
-
222
-
223
-
224
-
225
-
226
-
227
-
228
-
229
-
230
-
231
-
232
-
233
-
234
-
235
-
236
-
237
-
238
-
239
-
240
 |
 |

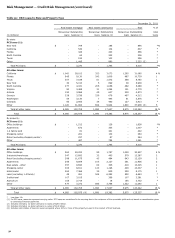
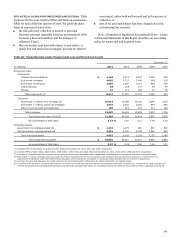
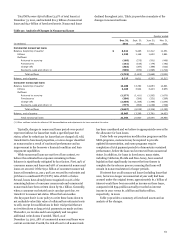
Table 22: European Exposure
Lending (1)(2)
Securities (3)
Derivatives and other (4)
Total exposure
Non-
Non-
Non-
Non-
(in millions)
Sovereign
sovereign
Sovereign
sovereign
Sovereign
sovereign
Sovereign
sovereign (5)
Total
December 31, 2011
Eurozone:
Germany
$
57
2,547
-
240
-
185
57
2,972
3,029
Netherlands
-
2,107
-
111
-
72
-
2,290
2,290
Spain
-
1,109
-
97
-
30
-
1,236
1,236
Luxembourg
-
1,010
-
123
-
2
-
1,135
1,135
France
87
517
-
302
-
165
87
984
1,071
Ireland
100
772
-
53
-
23
100
848
948
Italy
-
465
-
124
-
1
-
590
590
Austria
95
222
-
19
-
1
95
242
337
Other (6)
21
531
4
185
-
27
25
743
768
Total Eurozone exposure
360
9,280
4
1,254
-
506
364
11,040
11,404
United Kingdom
1,707
3,996
-
4,983
-
331
1,707
9,310
11,017
Other European countries
-
4,996
3
268
8
955
11
6,219
6,230
Total European exposure
$
2,067
18,272
7
6,505
8
1,792
2,082
26,569
28,651
(1)
Lending exposure includes funded loans and unfunded commitments, leveraged leases, and money market placements presented on a gross basis prior to the deduction of
impairment allowance and collateral received under the terms of the credit agreements.
(2)
Includes $1.6 billion in PCI loans, predominantly to customers in Germany and United Kingdom territories, and $3.1 billion in defeased leases secured predominantly by U.S.
Treasury and government agency securities, or government guaranteed.
(3)
Represents issuer exposure on cross-border debt and equity securities, held in trading or available-for-sale portfolio, at fair value.
(4)
Represents counterparty exposure on foreign exchange and derivative contracts, and securities resale and lending agreements. This exposure is presented net of
counterparty netting adjustments and reduced by the amount of cash collateral. It includes credit default swaps (CDS) predomi
nantly used to manage our U.S. and London
-
based cash credit trading businesses, which sometimes results in selling and pur
chasing protection on the identical reference entity. Generally, we do not use market
instruments such as CDS to hedge the credit risk of our investment or loan positions, although we do use them to manage risk
in our trading businesses. At
December
31, 2011, the gross notional amount of our CDS sold on reference assets domiciled in Europe was substantially offset by the notional of CDS purchased from
investment-grade counterparties. Additionally, at December 31, 2011, we did not have any net exposure on sovereign CDS associated with European countries.
(5)
Total non-sovereign exposure is comprised of $12.3 billion exposure to financial institutions and $14.3 billion to non-financial corporations at December 31, 2011.
(6)
Includes non-sovereign exposure to Greece and Portugal in the amount of $9.5 million and $ 49.1 million, respectively. We had no sovereign debt exposure to these
countries at December 31, 2011.
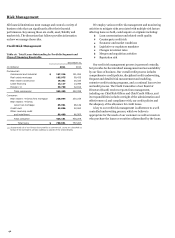
REAL ESTATE 1-4 FAMILY MORTGAGE LOANS
Our real estate 1-
4 family mortgage loans primarily include loans we have made to
customers and retained as part of our asset liability management
strategy. These loans also include the Pick-a-Pay portfolio
acquired from Wachovia and the home equity portfolio, which
are discussed later in this Report. In addition, these loans
include other purchased loans and loans included on our balance
sheet due to the adoption of consolidation accounting guidance
related to VIEs.
Our underwriting and periodic review of loans collateralized
by residential real property includes appraisals or estimates
from automated valuation models (AVMs) to support property
values. AVMs are computer-based tools used to estimate the
market value of homes. AVMs are a lower-cost alternative to
appraisals and support valuations of large numbers of properties
in a short period of time using market comparables and price
trends for local market areas. The primary risk associated with
the use of AVMs is that the value of an individual property may
vary significantly from the average for the market area. We have
processes to periodically validate AVMs and specific risk
management guidelines addressing the circumstances when
AVMs may be used. AVMs are generally used in underwriting to
support property values on loan originations only where the loan
amount is under $250,000. We generally require property
visitation appraisals by a qualified independent appraiser for
larger residential property loans.
Some of our real estate 1-4 family first and junior lien
mortgage loans include an interest-only feature as part of the
loan terms. These interest-only loans were approximately 21% of
total loans at December 31, 2011, and 25% at December 31, 2010.
Substantially all of these interest-only loans at origination were
considered to be prime or near prime.
We believe we have manageable adjustable-rate mortgage
(ARM) reset risk across our owned mortgage loan portfolios. We
do not offer option ARM products, nor do we offer variable-rate
mortgage products with fixed payment amounts, commonly
referred to within the financial services industry as negative
amortizing mortgage loans. Our liquidating option ARM
portfolio was acquired from Wachovia.
We continue to modify real estate 1-4 family mortgage loans
to assist homeowners and other borrowers in the current
difficult economic cycle. Loans are underwritten at the time of
the modification in accordance with underwriting guidelines
established for governmental and proprietary loan modification
programs. As a participant in the U.S. Treasury’s Making Home
Affordable (MHA) programs, we are focused on helping
customers stay in their homes. The MHA programs create a
standardization of modification terms including incentives paid
to borrowers, servicers, and investors. MHA includes the Home
Affordable Modification Program (HAMP) for first lien loans and
the Second Lien Modification Program (2MP) for junior lien
loans. Under both our proprietary programs and the MHA
programs, we may provide concessions such as interest rate
reductions, forbearance of principal, and in some cases,
principal forgiveness. These programs generally include trial
payment periods of three to four months, and after successful
completion and compliance with terms during this period, the
loan is permanently modified. During both the trial payment
period and/or permanent modification period, the loan is
accounted for as a TDR loan. See Table 32 for discussion on trial
modifications, including balances. See Note 6 (Loans and
Allowance for Credit Losses) to Financial Statements in this
Report for discussion on how we determine the allowance
attributable to our modified residential real estate portfolios.
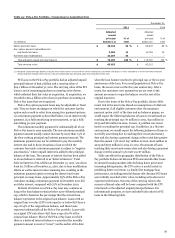
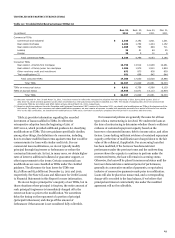
The concentrations of real estate 1-4 family first and junior
lien mortgage loans by state are presented in Table 23. Our real
estate 1-4 family mortgage loans to borrowers in California
represented approximately 13% of total loans (3% of this amount
53