Wells Fargo 2011 Annual Report Download - page 150
Download and view the complete annual report
Please find page 150 of the 2011 Wells Fargo annual report below. You can navigate through the pages in the report by either clicking on the pages listed below, or by using the keyword search tool below to find specific information within the annual report.-
 1
1 -
2
-
3
-
4
-
5
-
6
-
7
-
8
-
9
-
10
-
11
-
12
-
13
-
14
-
15
-
16
-
17
-
18
-
19
-
20
-
21
-
22
-
23
-
24
-
25
-
26
-
27
-
28
-
29
-
30
-
31
-
32
-
33
-
34
-
35
-
36
-
37
-
38
-
39
-
40
-
41
-
42
-
43
-
44
-
45
-
46
-
47
-
48
-
49
-
50
-
51
-
52
-
53
-
54
-
55
-
56
-
57
-
58
-
59
-
60
-
61
-
62
-
63
-
64
-
65
-
66
-
67
-
68
-
69
-
70
-
71
-
72
-
73
-
74
-
75
-
76
-
77
-
78
-
79
-
80
-
81
-
82
-
83
-
84
-
85
-
86
-
87
-
88
-
89
-
90
-
91
-
92
-
93
-
94
-
95
-
96
-
97
-
98
-
99
-
100
-
101
-
102
-
103
-
104
-
105
-
106
-
107
-
108
-
109
-
110
-
111
-
112
-
113
-
114
-
115
-
116
-
117
-
118
-
119
-
120
-
121
-
122
-
123
-
124
-
125
-
126
-
127
-
128
-
129
-
130
-
131
-
132
-
133
-
134
-
135
-
136
-
137
-
138
-
139
-
 140
140 -
 141
141 -
 142
142 -
 143
143 -
 144
144 -
 145
145 -
 146
146 -
 147
147 -
 148
148 -
 149
149 -
 150
150 -
 151
151 -
 152
152 -
 153
153 -
 154
154 -
 155
155 -
 156
156 -
 157
157 -
 158
158 -
 159
159 -
 160
160 -
161
-
162
-
163
-
164
-
165
-
166
-
167
-
168
-
169
-
170
-
171
-
172
-
173
-
174
-
175
-
176
-
177
-
178
-
179
-
180
-
181
-
182
-
183
-
184
-
185
-
186
-
187
-
188
-
189
-
190
-
191
-
192
-
193
-
194
-
195
-
196
-
197
-
198
-
199
-
200
-
201
-
202
-
203
-
204
-
205
-
206
-
207
-
208
-
209
-
210
-
211
-
212
-
213
-
214
-
215
-
216
-
217
-
218
-
219
-
220
-
221
-
222
-
223
-
224
-
225
-
226
-
227
-
228
-
229
-
230
-
231
-
232
-
233
-
234
-
235
-
236
-
237
-
238
-
239
-
240
 |
 |

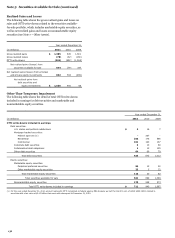
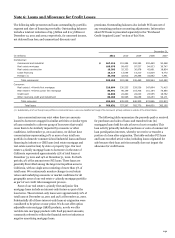
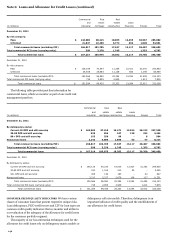
Note 6: Loans and Allowance for Credit Losses (continued)
Real estate
Real estate
Other
1-4 family
1-4 family
revolving
first
junior lien
Credit
credit and
(in millions)
mortgage
mortgage
card
installment
Total
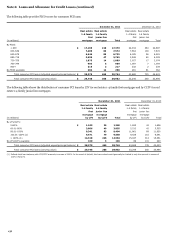
December 31, 2011
By updated FICO:
< 600
$
21,604
7,428
2,323
8,921
40,276
600-639
10,978
4,086
1,787
6,222
23,073
640-679
15,563
7,187
3,383
9,350
35,483
680-719
23,622
12,497
4,697
10,465
51,281
720-759
27,417
17,574
4,760
9,936
59,687
760-799
47,337
24,979
3,517
11,163
86,996
800+
21,381
10,247
1,969
5,674
39,271
No FICO available
4,691
1,787
400
4,393
11,271
FICO not required
-
-
-
4,990
4,990
Government insured/guaranteed loans (1)
26,555
-
-
15,346
41,901
Total consumer loans (excluding PCI)
199,148
85,785
22,836
86,460
394,229
Total consumer PCI loans (carrying value)
29,746
206
-
-
29,952
Total consumer loans
$
228,894
85,991
22,836
86,460
424,181
December 31, 2010 (2)
By updated FICO:
< 600
$
26,013
9,126
2,872
10,806
48,817
600-639
11,105
4,457
1,826
5,965
23,353
640-679
16,202
7,678
3,305
8,344
35,529
680-719
25,549
13,759
4,522
9,480
53,310
720-759
29,443
20,334
4,441
8,808
63,026
760-799
47,250
27,222
3,215
9,357
87,044
800+
19,719
10,607
1,794
4,692
36,812
No FICO available
6,195
2,716
285
7,528
16,724
FICO not required
-
-
-
4,132
4,132
Government insured/guaranteed loans (1)
15,514
-
-
17,453
32,967
Total consumer loans (excluding PCI)
196,990
95,899
22,260
86,565
401,714
Total consumer PCI loans (carrying value)
33,245
250
-
-
33,495
Total consumer loans
$
230,235
96,149
22,260
86,565
435,209
(1) Represents loans whose repayments are insured by the FHA or guaranteed by the VA and student loans whose repayments are predominantly guaranteed by agencies on
behalf of the U.S. Department of Education under FFELP. In 2011, we consolidated $5.6 billion of previously sold FHA insured real estate 1-4 family reverse mortgages.
(2) Amounts at December 31, 2010, have been revised to conform to the current separate presentation of government insured/guaranteed loans.
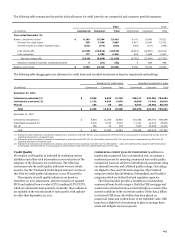
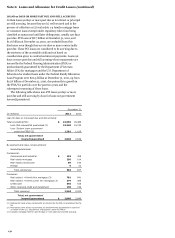
LTV refers to the ratio comparing the loan’s balance to the
property’s collateral value. CLTV refers to the combination of
first mortgage and junior lien mortgage (including unused line
amounts for credit line products) ratios. LTVs and CLTVs are
updated quarterly using a cascade approach which first uses
values provided by automated valuation models (AVMs) for the
property. If an AVM is not available, then the value is estimated
using the original appraised value adjusted by the change in
Home Price Index (HPI) for the property location. If an HPI is
not available, the original appraised value is used. The HPI value
is normally the only method considered for high value properties
as the AVM values have proven less accurate for these
properties.
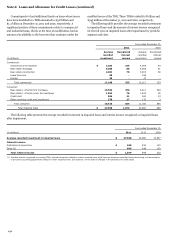
The following table shows the most updated LTV and CLTV
distribution of the real estate 1-4 family first and junior lien
mortgage loan portfolios. In recent years, the residential real
estate markets have experienced significant declines in property
values and several markets, particularly California and Florida
have experienced declines that turned out to be more significant
than the national decline. These trends are considered in the way
that we monitor credit risk and establish our allowance for credit
losses. LTV does not necessarily reflect the likelihood of
performance of a given loan, but does provide an indication of
collateral value. In the event of a default, any loss should be
limited to the portion of the loan amount in excess of the net
realizable value of the underlying real estate collateral value.
Certain loans do not have an LTV or CLTV primarily due to
industry data availability and portfolios acquired from or
serviced by other institutions.
148