Wells Fargo 2011 Annual Report Download - page 69
Download and view the complete annual report
Please find page 69 of the 2011 Wells Fargo annual report below. You can navigate through the pages in the report by either clicking on the pages listed below, or by using the keyword search tool below to find specific information within the annual report.-
 1
1 -
2
-
3
-
4
-
5
-
6
-
7
-
8
-
9
-
10
-
11
-
12
-
13
-
14
-
15
-
16
-
17
-
18
-
19
-
20
-
21
-
22
-
23
-
24
-
25
-
26
-
27
-
28
-
29
-
30
-
31
-
32
-
33
-
34
-
35
-
36
-
37
-
38
-
39
-
40
-
41
-
42
-
43
-
44
-
45
-
46
-
47
-
48
-
49
-
50
-
51
-
52
-
53
-
54
-
55
-
56
-
57
-
58
-
 59
59 -
 60
60 -
 61
61 -
 62
62 -
 63
63 -
 64
64 -
 65
65 -
 66
66 -
 67
67 -
 68
68 -
 69
69 -
 70
70 -
 71
71 -
 72
72 -
 73
73 -
 74
74 -
 75
75 -
 76
76 -
 77
77 -
 78
78 -
 79
79 -
80
-
81
-
82
-
83
-
84
-
85
-
86
-
87
-
88
-
89
-
90
-
91
-
92
-
93
-
94
-
95
-
96
-
97
-
98
-
99
-
100
-
101
-
102
-
103
-
104
-
105
-
106
-
107
-
108
-
109
-
110
-
111
-
112
-
113
-
114
-
115
-
116
-
117
-
118
-
119
-
120
-
121
-
122
-
123
-
124
-
125
-
126
-
127
-
128
-
129
-
130
-
131
-
132
-
133
-
134
-
135
-
136
-
137
-
138
-
139
-
140
-
141
-
142
-
143
-
144
-
145
-
146
-
147
-
148
-
149
-
150
-
151
-
152
-
153
-
154
-
155
-
156
-
157
-
158
-
159
-
160
-
161
-
162
-
163
-
164
-
165
-
166
-
167
-
168
-
169
-
170
-
171
-
172
-
173
-
174
-
175
-
176
-
177
-
178
-
179
-
180
-
181
-
182
-
183
-
184
-
185
-
186
-
187
-
188
-
189
-
190
-
191
-
192
-
193
-
194
-
195
-
196
-
197
-
198
-
199
-
200
-
201
-
202
-
203
-
204
-
205
-
206
-
207
-
208
-
209
-
210
-
211
-
212
-
213
-
214
-
215
-
216
-
217
-
218
-
219
-
220
-
221
-
222
-
223
-
224
-
225
-
226
-
227
-
228
-
229
-
230
-
231
-
232
-
233
-
234
-
235
-
236
-
237
-
238
-
239
-
240
 |
 |
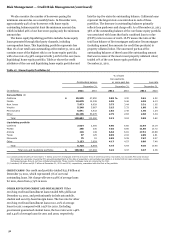
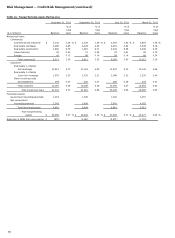
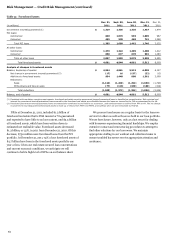
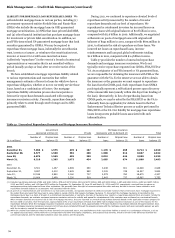
Table 35 presents net charge-offs for the four quarters and
full year of 2011 and 2010. Net charge-offs in 2011 were
$11.3 billion (1.49% of average total loans outstanding)
compared with $17.8 billion (2.30%) in 2010. Total net charge-
offs decreased in 2011 due in part to modestly improving
economic conditions, aggressive loss mitigation activities aimed
at working with our customers through their financial
challenges, and a runoff of the pool of the most challenged
vintages/relationships in the portfolio. Total net charge-offs
decreased in each of the first three quarters of the year and were
essentially flat in fourth quarter 2011.
Net charge-offs in the 1-4 family first mortgage portfolio
totaled $3.5 billion in 2011, compared with $4.4 billion a year
ago.
Net charge-offs in the real estate 1-4 family junior lien
portfolio decreased $1.2 billion to $3.5 billion in 2011. More
information about the home equity portfolio, which includes
substantially all of our real estate 1-4 family junior lien mortgage
loans, is available in Table 27 in this Report and the related
discussion.
Credit card charge-offs decreased $980 million to
$1.2 billion in 2011. Delinquency levels stabilized and loss levels
continued to improve in 2011 as the economy showed signs of
stabilization.
Commercial net charge-offs were $2.0 billion in 2011
compared with $4.8 billion in 2010, as market liquidity and
improving market conditions helped stabilize performance
results.
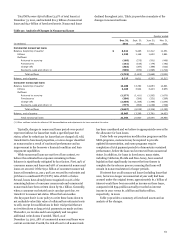
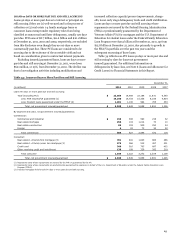
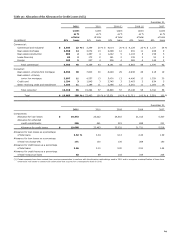
ALLOWANCE FOR CREDIT LOSSES
The allowance for credit
losses, which consists of the allowance for loan losses and the
allowance for unfunded credit commitments, is management’s
estimate of credit losses inherent in the loan portfolio and
unfunded credit commitments at the balance sheet date,
excluding loans carried at fair value. The detail of the changes in
the allowance for credit losses by portfolio segment (including
charge-offs and recoveries by loan class) is in Note 6 (Loans and
Allowance for Credit Losses) to Financial Statements in this
Report.
We employ a disciplined process and methodology to
establish our allowance for credit losses each quarter. This
process takes into consideration many factors, including
historical and forecasted loss trends, loan-level credit quality
ratings and loan grade-specific loss factors. The process involves
subjective as well as complex judgments. In addition, we review
a variety of credit metrics and trends. These trends, however, do
not solely determine the appropriate allowance amount as we
use several analytical tools. For additional information on our
allowance for credit losses, see the “Critical Accounting Policies
– Allowance for Credit Losses” section and Note 6 (Loans and
Allowance for Credit Losses) to Financial Statements in this
Report.
We believe the allowance for credit losses of $19.7 billion at
December 31, 2011, was appropriate to cover credit losses
inherent in the loan portfolio, including unfunded credit
commitments, at December 31, 2011. The allowance for credit
losses is subject to change and reflects existing factors as of the
date of determination, including economic or market conditions
and ongoing internal and external examination processes. Due
to the sensitivity of the allowance for credit losses to changes in
the business environment, it is possible that we will incur
incremental credit losses not anticipated as of the balance sheet
date. In addition to the allowance for credit losses there was
$10.7 billion and $13.4 billion of nonaccretable difference at
December 31, 2011 and 2010, respectively, to absorb losses for
PCI loans.
As a result of PCI accounting, the book value of high risk
loans was written down at the time of acquisition. Therefore, the
allowance for credit losses is lower than otherwise would have
been required without PCI loan accounting and certain ratios of
the Company may not be directly comparable with periods prior
to the Wachovia merger or with credit-related ratios of other
financial institutions. For additional information on PCI loans,
see the “Risk Management – Credit Risk Management –
Purchased Credit-Impaired Loans” section and Note 6 (Loans
and Allowance for Credit Losses) to Financial Statements in this
Report.
The ratio of the allowance for credit losses to total
nonaccrual loans may fluctuate significantly from period to
period due to such factors as the mix of loan types in the
portfolio, borrower credit strength and the value and
marketability of collateral. Over half of nonaccrual loans were
home mortgages, auto and other consumer loans at
December 31, 2011.
67