Wells Fargo 2011 Annual Report Download - page 80
Download and view the complete annual report
Please find page 80 of the 2011 Wells Fargo annual report below. You can navigate through the pages in the report by either clicking on the pages listed below, or by using the keyword search tool below to find specific information within the annual report.-
 1
1 -
2
-
3
-
4
-
5
-
6
-
7
-
8
-
9
-
10
-
11
-
12
-
13
-
14
-
15
-
16
-
17
-
18
-
19
-
20
-
21
-
22
-
23
-
24
-
25
-
26
-
27
-
28
-
29
-
30
-
31
-
32
-
33
-
34
-
35
-
36
-
37
-
38
-
39
-
40
-
41
-
42
-
43
-
44
-
45
-
46
-
47
-
48
-
49
-
50
-
51
-
52
-
53
-
54
-
55
-
56
-
57
-
58
-
59
-
60
-
61
-
62
-
63
-
64
-
65
-
66
-
67
-
68
-
69
-
 70
70 -
 71
71 -
 72
72 -
 73
73 -
 74
74 -
 75
75 -
 76
76 -
 77
77 -
 78
78 -
 79
79 -
 80
80 -
 81
81 -
 82
82 -
 83
83 -
 84
84 -
 85
85 -
 86
86 -
 87
87 -
 88
88 -
 89
89 -
 90
90 -
91
-
92
-
93
-
94
-
95
-
96
-
97
-
98
-
99
-
100
-
101
-
102
-
103
-
104
-
105
-
106
-
107
-
108
-
109
-
110
-
111
-
112
-
113
-
114
-
115
-
116
-
117
-
118
-
119
-
120
-
121
-
122
-
123
-
124
-
125
-
126
-
127
-
128
-
129
-
130
-
131
-
132
-
133
-
134
-
135
-
136
-
137
-
138
-
139
-
140
-
141
-
142
-
143
-
144
-
145
-
146
-
147
-
148
-
149
-
150
-
151
-
152
-
153
-
154
-
155
-
156
-
157
-
158
-
159
-
160
-
161
-
162
-
163
-
164
-
165
-
166
-
167
-
168
-
169
-
170
-
171
-
172
-
173
-
174
-
175
-
176
-
177
-
178
-
179
-
180
-
181
-
182
-
183
-
184
-
185
-
186
-
187
-
188
-
189
-
190
-
191
-
192
-
193
-
194
-
195
-
196
-
197
-
198
-
199
-
200
-
201
-
202
-
203
-
204
-
205
-
206
-
207
-
208
-
209
-
210
-
211
-
212
-
213
-
214
-
215
-
216
-
217
-
218
-
219
-
220
-
221
-
222
-
223
-
224
-
225
-
226
-
227
-
228
-
229
-
230
-
231
-
232
-
233
-
234
-
235
-
236
-
237
-
238
-
239
-
240
 |
 |

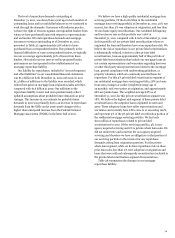
Asset/Liability Management
Asset/liability management involves the evaluation,
monitoring and management of interest rate risk, market risk,
liquidity and funding. The Corporate Asset/Liability
Management Committee (Corporate ALCO), which oversees
these risks and reports periodically to the Finance Committee
of the Board, consists of senior financial and business
executives. Each of our principal business groups has its own
asset/liability management committee and process linked to
the Corporate ALCO process.
INTEREST RATE RISK
Interest rate risk, which potentially can
have a significant earnings impact, is an integral part of being a
financial intermediary. We are subject to interest rate risk
because:
assets and liabilities may mature or reprice at different
times (for example, if assets reprice faster than liabilities
and interest rates are generally falling, earnings will
initially decline);
assets and liabilities may reprice at the same time but by
different amounts (for example, when the general level of
interest rates is falling, we may reduce rates paid on
checking and savings deposit accounts by an amount that
is less than the general decline in market interest rates);
short-term and long-term market interest rates may
change by different amounts (for example, the shape of the
yield curve may affect new loan yields and funding costs
differently); or
the remaining maturity of various assets or liabilities may
shorten or lengthen as interest rates change (for example,
if long-term mortgage interest rates decline sharply, MBS
held in the securities available-for-sale portfolio may
prepay significantly earlier than anticipated, which could
reduce portfolio income).
Interest rates may also have a direct or indirect effect on
loan demand, credit losses, mortgage origination volume, the
fair value of MSRs and other financial instruments, the value of
the pension liability and other items affecting earnings.
We assess interest rate risk by comparing our most likely
earnings plan with various earnings simulations using many
interest rate scenarios that differ in the direction of interest
rate changes, the degree of change over time, the speed of
change and the projected shape of the yield curve. For example,
as of December 31, 2011, our most recent simulation indicated
estimated earnings at risk of less than 1% of our most likely
earnings plan over the next 12 months under a range of both
lower and higher interest rates, including a scenario in which
the federal funds rate remains unchanged and the 10-year
Constant Maturity Treasury bond yield averages below 2.00%,
and a scenario in which the federal funds rate rises to 3.75%
and the 10-year Constant Maturity Treasury bond yield
increases to 5.10%. Simulation estimates depend on, and will
change with, the size and mix of our actual and projected
balance sheet at the time of each simulation. Due to timing
differences between the quarterly valuation of MSRs and the
eventual impact of interest rates on mortgage banking
volumes, earnings at risk in any particular quarter could be
higher than the average earnings at risk over the 12-month
simulation period, depending on the path of interest rates and
on our hedging strategies for MSRs. See the “Risk Management
– Mortgage Banking Interest Rate and Market Risk” section in
this Report for more information.
We use exchange-traded and over-the-counter (OTC)
interest rate derivatives to hedge our interest rate exposures.
The notional or contractual amount, credit risk amount and
estimated net fair value of these derivatives as of
December 31, 2011 and 2010, are presented in Note 16
(Derivatives) to Financial Statements in this Report. We use
derivatives for asset/liability management in three main ways:
to convert a major portion of our long-term fixed-rate
debt, which we issue to finance the Company, from fixed-
rate payments to floating-rate payments by entering into
receive-fixed swaps;
to convert the cash flows from selected asset and/or
liability instruments/portfolios from fixed-rate payments
to floating-rate payments or vice versa; and
to economically hedge our mortgage origination pipeline,
funded mortgage loans and MSRs using interest rate
swaps, swaptions, futures, forwards and options.
MORTGAGE BANKING INTEREST RATE AND MARKET RISK
We originate, fund and service mortgage loans, which subjects
us to various risks, including credit, liquidity and interest rate
risks. Based on market conditions and other factors, we reduce
credit and liquidity risks by selling or securitizing some or all of
the long-term fixed-rate mortgage loans we originate and most
of the ARMs we originate. On the other hand, we may hold
originated ARMs and fixed-rate mortgage loans in our loan
portfolio as an investment for our growing base of core
deposits. We determine whether the loans will be held for
investment or held for sale at the time of commitment. We may
subsequently change our intent to hold loans for investment
and sell some or all of our ARMs or fixed-rate mortgages as
part of our corporate asset/liability management. We may also
acquire and add to our securities available for sale a portion of
the securities issued at the time we securitize MHFS.
Notwithstanding the continued downturn in the housing
sector, and the continued lack of liquidity in the
nonconforming secondary markets, our mortgage banking
revenue remained strong, reflecting the complementary
origination and servicing strengths of the business. The
secondary market for agency-conforming mortgages
functioned well during 2011.
Interest rate and market risk can be substantial in the
mortgage business. Changes in interest rates may potentially
reduce total origination and servicing fees, the value of our
residential MSRs measured at fair value, the value of MHFS
and the associated income and loss reflected in mortgage
banking noninterest income, the income and expense
associated with instruments (economic hedges) used to hedge
changes in the fair value of MSRs and MHFS, and the value of
derivative loan commitments (interest rate “locks”) extended to
mortgage applicants.
Interest rates affect the amount and timing of origination
and servicing fees because consumer demand for new
78