Wells Fargo 2011 Annual Report Download - page 169
Download and view the complete annual report
Please find page 169 of the 2011 Wells Fargo annual report below. You can navigate through the pages in the report by either clicking on the pages listed below, or by using the keyword search tool below to find specific information within the annual report.-
 1
1 -
2
-
3
-
4
-
5
-
6
-
7
-
8
-
9
-
10
-
11
-
12
-
13
-
14
-
15
-
16
-
17
-
18
-
19
-
20
-
21
-
22
-
23
-
24
-
25
-
26
-
27
-
28
-
29
-
30
-
31
-
32
-
33
-
34
-
35
-
36
-
37
-
38
-
39
-
40
-
41
-
42
-
43
-
44
-
45
-
46
-
47
-
48
-
49
-
50
-
51
-
52
-
53
-
54
-
55
-
56
-
57
-
58
-
59
-
60
-
61
-
62
-
63
-
64
-
65
-
66
-
67
-
68
-
69
-
70
-
71
-
72
-
73
-
74
-
75
-
76
-
77
-
78
-
79
-
80
-
81
-
82
-
83
-
84
-
85
-
86
-
87
-
88
-
89
-
90
-
91
-
92
-
93
-
94
-
95
-
96
-
97
-
98
-
99
-
100
-
101
-
102
-
103
-
104
-
105
-
106
-
107
-
108
-
109
-
110
-
111
-
112
-
113
-
114
-
115
-
116
-
117
-
118
-
119
-
120
-
121
-
122
-
123
-
124
-
125
-
126
-
127
-
128
-
129
-
130
-
131
-
132
-
133
-
134
-
135
-
136
-
137
-
138
-
139
-
140
-
141
-
142
-
143
-
144
-
145
-
146
-
147
-
148
-
149
-
150
-
151
-
152
-
153
-
154
-
155
-
156
-
157
-
158
-
 159
159 -
 160
160 -
 161
161 -
 162
162 -
 163
163 -
 164
164 -
 165
165 -
 166
166 -
 167
167 -
 168
168 -
 169
169 -
 170
170 -
 171
171 -
 172
172 -
 173
173 -
 174
174 -
 175
175 -
 176
176 -
 177
177 -
 178
178 -
 179
179 -
180
-
181
-
182
-
183
-
184
-
185
-
186
-
187
-
188
-
189
-
190
-
191
-
192
-
193
-
194
-
195
-
196
-
197
-
198
-
199
-
200
-
201
-
202
-
203
-
204
-
205
-
206
-
207
-
208
-
209
-
210
-
211
-
212
-
213
-
214
-
215
-
216
-
217
-
218
-
219
-
220
-
221
-
222
-
223
-
224
-
225
-
226
-
227
-
228
-
229
-
230
-
231
-
232
-
233
-
234
-
235
-
236
-
237
-
238
-
239
-
240
 |
 |

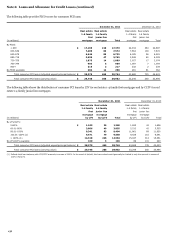
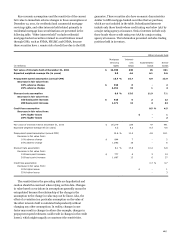
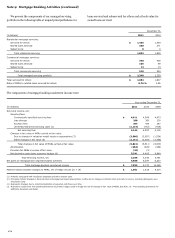
Key economic assumptions and the sensitivity of the current
fair value to immediate adverse changes in those assumptions at
December 31, 2011, for residential and commercial mortgage
servicing rights, and other interests held related primarily to
residential mortgage loan securitizations are presented in the
following table. “Other interests held” exclude residential
mortgage-backed securities retained in securitizations issued
through GSEs, such as FNMA, FHLMC and GNMA, because
these securities have a remote risk of credit loss due to the GSE
guarantee. These securities also have economic characteristics
similar to GSE mortgage-backed securities that we purchase,
which are not included in the table. Subordinated interests
include only those bonds whose credit rating was below AAA by
a major rating agency at issuance. Senior interests include only
those bonds whose credit rating was AAA by a major rating
agency at issuance. The information presented excludes trading
positions held in inventory.
Other interests held
Mortgage
Interest-
servicing
only
Subordinated
Senior
(in millions)
rights
strips
bonds
bonds
Fair value of interests held at December 31, 2011
$
14,359
230
45
321
Expected weighted-average life (in years)
5.0
4.6
6.1
5.6
Prepayment speed assumption (annual CPR)
13.7
%
10.7
6.9
13.9
Decrease in fair value from:
10% adverse change
$
913
6
-
2
25% adverse change
2,151
15
1
4
Discount rate assumption
6.9
%
15.6
11.9
7.1
Decrease in fair value from:
100 basis point increase
$
613
6
2
12
200 basis point increase
1,171
12
4
24
Credit loss assumption
0.5
%
4.5
Decrease in fair value from:
10% higher losses
$
-
1
25% higher losses
-
2
Fair value of interests held at December 31, 2010
$
16,279
226
47
441
Expected weighted-average life (in years)
5.2
5.2
8.3
4.5
Prepayment speed assumption (annual CPR)
12.6
%
11.4
4.8
18.1
Decrease in fair value from:
10% adverse change
$
844
7
-
2
25% adverse change
1,992
16
-
6
Discount rate assumption
8.1
%
17.8
10.2
6.8
Decrease in fair value from:
100 basis point increase
$
777
6
3
14
200 basis point increase
1,487
13
6
27
Credit loss assumption
0.7
%
3.7
Decrease in fair value from:
10% higher losses
$
-
1
25% higher losses
-
3
The sensitivities in the preceding table are hypothetical and
caution should be exercised when relying on this data. Changes
in value based on variations in assumptions generally cannot be
extrapolated because the relationship of the change in the
assumption to the change in value may not be linear. Also, the
effect of a variation in a particular assumption on the value of
the other interests held is calculated independently without
changing any other assumptions. In reality, changes in one
factor may result in changes in others (for example, changes in
prepayment speed estimates could result in changes in the credit
losses), which might magnify or counteract the sensitivities.
167