Wells Fargo 2011 Annual Report Download - page 117
Download and view the complete annual report
Please find page 117 of the 2011 Wells Fargo annual report below. You can navigate through the pages in the report by either clicking on the pages listed below, or by using the keyword search tool below to find specific information within the annual report.-
 1
1 -
2
-
3
-
4
-
5
-
6
-
7
-
8
-
9
-
10
-
11
-
12
-
13
-
14
-
15
-
16
-
17
-
18
-
19
-
20
-
21
-
22
-
23
-
24
-
25
-
26
-
27
-
28
-
29
-
30
-
31
-
32
-
33
-
34
-
35
-
36
-
37
-
38
-
39
-
40
-
41
-
42
-
43
-
44
-
45
-
46
-
47
-
48
-
49
-
50
-
51
-
52
-
53
-
54
-
55
-
56
-
57
-
58
-
59
-
60
-
61
-
62
-
63
-
64
-
65
-
66
-
67
-
68
-
69
-
70
-
71
-
72
-
73
-
74
-
75
-
76
-
77
-
78
-
79
-
80
-
81
-
82
-
83
-
84
-
85
-
86
-
87
-
88
-
89
-
90
-
91
-
92
-
93
-
94
-
95
-
96
-
97
-
98
-
99
-
100
-
101
-
102
-
103
-
104
-
105
-
106
-
 107
107 -
 108
108 -
 109
109 -
 110
110 -
 111
111 -
 112
112 -
 113
113 -
 114
114 -
 115
115 -
 116
116 -
 117
117 -
 118
118 -
 119
119 -
 120
120 -
 121
121 -
 122
122 -
 123
123 -
 124
124 -
 125
125 -
 126
126 -
 127
127 -
128
-
129
-
130
-
131
-
132
-
133
-
134
-
135
-
136
-
137
-
138
-
139
-
140
-
141
-
142
-
143
-
144
-
145
-
146
-
147
-
148
-
149
-
150
-
151
-
152
-
153
-
154
-
155
-
156
-
157
-
158
-
159
-
160
-
161
-
162
-
163
-
164
-
165
-
166
-
167
-
168
-
169
-
170
-
171
-
172
-
173
-
174
-
175
-
176
-
177
-
178
-
179
-
180
-
181
-
182
-
183
-
184
-
185
-
186
-
187
-
188
-
189
-
190
-
191
-
192
-
193
-
194
-
195
-
196
-
197
-
198
-
199
-
200
-
201
-
202
-
203
-
204
-
205
-
206
-
207
-
208
-
209
-
210
-
211
-
212
-
213
-
214
-
215
-
216
-
217
-
218
-
219
-
220
-
221
-
222
-
223
-
224
-
225
-
226
-
227
-
228
-
229
-
230
-
231
-
232
-
233
-
234
-
235
-
236
-
237
-
238
-
239
-
240
 |
 |

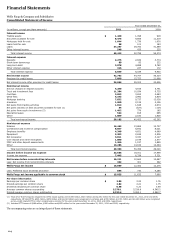
Wells Fargo & Company and Subsidiaries
Consolidated Balance Sheet
December 31,
(in millions, except shares)
2011
2010
Assets
Cash and due from banks
$
19,440
16,044
Federal funds sold, securities purchased under resale agreements and other short-term investments
44,367
80,637
Trading assets
77,814
51,414
Securities available for sale
222,613
172,654
Mortgages held for sale (includes $44,791 and $47,531 carried at fair value)
48,357
51,763
Loans held for sale (includes $1,176 and $873 carried at fair value)
1,338
1,290
Loans (includes $5,916 and $309 carried at fair value)
769,631
757,267
Allowance for loan losses
(19,372)
(23,022)
Net loans
750,259
734,245
Mortgage servicing rights:
Measured at fair value
12,603
14,467
Amortized
1,408
1,419
Premises and equipment, net
9,531
9,644
Goodwill
25,115
24,770
Other assets
101,022
99,781
Total assets (1)
$
1,313,867
1,258,128
Liabilities
Noninterest-bearing deposits
$
244,003
191,256
Interest-bearing deposits
676,067
656,686
Total deposits
920,070
847,942
Short-term borrowings
49,091
55,401
Accrued expenses and other liabilities
77,665
69,913
Long-term debt (includes $0 and $306 carried at fair value)
125,354
156,983
Total liabilities (2)
1,172,180
1,130,239
Equity
Wells Fargo stockholders' equity:
Preferred stock
11,431
8,689
Common stock – $1-2/3 par value, authorized 9,000,000,000 shares;
issued 5,358,522,061 shares and 5,272,414,622 shares
8,931
8,787
Additional paid-in capital
55,957
53,426
Retained earnings
64,385
51,918
Cumulative other comprehensive income
3,207
4,738
Treasury stock – 95,910,425 shares and 10,131,394 shares
(2,744)
(487)
Unearned ESOP shares
(926)
(663)
Total Wells Fargo stockholders' equity
140,241
126,408
Noncontrolling interests
1,446
1,481
Total equity
141,687
127,889
Total liabilities and equity
$
1,313,867
1,258,128
(1) Our consolidated assets at December 31, 2011 and at December 31, 2010, include the following assets of certain variable interest entities (VIEs) that can only be used to
settle the liabilities of those VIEs: Cash and due from banks, $321 million and $200 million; Trading assets, $293 million and $143 million; Securities available for sale,
$3.3 billion and $2.2 billion; Mortgages held for sale, $444 million and $634 million; Net loans, $12.0 billion and $16.7 billion; Other assets, $1.9 billion and $2.1 billion; and
Total assets, $18.2 billion and $21.9 billion.
(2) Our consolidated liabilities at December 31, 2011 and at December 31, 2010, include the following VIE liabilities for which the VIE creditors do not have recourse to Wells
Fargo: Short-term borrowings, $24 million and $7 million; Accrued expenses and other liabilities, $175 million and $98 million; Long-term debt, $4.9 billion and $8.3 billion;
and Total liabilities, $5.1 billion and $8.4 billion.
The accompanying notes are an integral part of these statements.
115