Wells Fargo 2011 Annual Report Download - page 207
Download and view the complete annual report
Please find page 207 of the 2011 Wells Fargo annual report below. You can navigate through the pages in the report by either clicking on the pages listed below, or by using the keyword search tool below to find specific information within the annual report.-
 1
1 -
2
-
3
-
4
-
5
-
6
-
7
-
8
-
9
-
10
-
11
-
12
-
13
-
14
-
15
-
16
-
17
-
18
-
19
-
20
-
21
-
22
-
23
-
24
-
25
-
26
-
27
-
28
-
29
-
30
-
31
-
32
-
33
-
34
-
35
-
36
-
37
-
38
-
39
-
40
-
41
-
42
-
43
-
44
-
45
-
46
-
47
-
48
-
49
-
50
-
51
-
52
-
53
-
54
-
55
-
56
-
57
-
58
-
59
-
60
-
61
-
62
-
63
-
64
-
65
-
66
-
67
-
68
-
69
-
70
-
71
-
72
-
73
-
74
-
75
-
76
-
77
-
78
-
79
-
80
-
81
-
82
-
83
-
84
-
85
-
86
-
87
-
88
-
89
-
90
-
91
-
92
-
93
-
94
-
95
-
96
-
97
-
98
-
99
-
100
-
101
-
102
-
103
-
104
-
105
-
106
-
107
-
108
-
109
-
110
-
111
-
112
-
113
-
114
-
115
-
116
-
117
-
118
-
119
-
120
-
121
-
122
-
123
-
124
-
125
-
126
-
127
-
128
-
129
-
130
-
131
-
132
-
133
-
134
-
135
-
136
-
137
-
138
-
139
-
140
-
141
-
142
-
143
-
144
-
145
-
146
-
147
-
148
-
149
-
150
-
151
-
152
-
153
-
154
-
155
-
156
-
157
-
158
-
159
-
160
-
161
-
162
-
163
-
164
-
165
-
166
-
167
-
168
-
169
-
170
-
171
-
172
-
173
-
174
-
175
-
176
-
177
-
178
-
179
-
180
-
181
-
182
-
183
-
184
-
185
-
186
-
187
-
188
-
189
-
190
-
191
-
192
-
193
-
194
-
195
-
196
-
 197
197 -
 198
198 -
 199
199 -
 200
200 -
 201
201 -
 202
202 -
 203
203 -
 204
204 -
 205
205 -
 206
206 -
 207
207 -
 208
208 -
 209
209 -
 210
210 -
 211
211 -
 212
212 -
 213
213 -
 214
214 -
 215
215 -
 216
216 -
 217
217 -
218
-
219
-
220
-
221
-
222
-
223
-
224
-
225
-
226
-
227
-
228
-
229
-
230
-
231
-
232
-
233
-
234
-
235
-
236
-
237
-
238
-
239
-
240
 |
 |

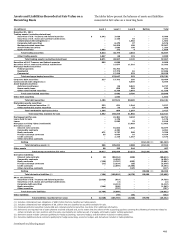
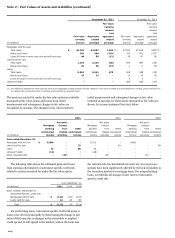
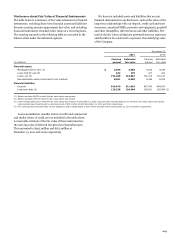
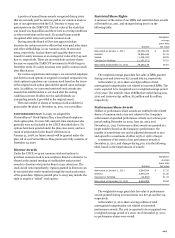
Disclosures about Fair Value of Financial Instruments
The table below is a summary of fair value estimates for financial
instruments, excluding short-term financial assets and liabilities
because carrying amounts approximate fair value, and excluding
financial instruments recorded at fair value on a recurring basis.
The carrying amounts in the following table are recorded in the
balance sheet under the indicated captions.
We have not included assets and liabilities that are not
financial instruments in our disclosure, such as the value of the
long-term relationships with our deposit, credit card and trust
customers, amortized MSRs, premises and equipment, goodwill
and other intangibles, deferred taxes and other liabilities. The
total of the fair value calculations presented does not represent,
and should not be construed to represent, the underlying value
of the Company.
December 31,
2011
2010
Carrying
Estimated
Carrying
Estimated
(in millions)
amount
fair value
amount
fair value
Financial assets
Mortgages held for sale (1)
$
3,566
3,566
4,232
4,234
Loans held for sale (2)
162
176
417
441
Loans, net (3)
731,308
723,867
721,016
710,147
Nonmarketable equity investments (cost method)
8,061
8,490
8,494
8,814
Financial liabilities
Deposits
920,070
921,803
847,942
849,642
Long-term debt (4)
125,238
126,484
156,651
159,996
(3)
(1) Balance excludes MHFS for which the fair value option was elected.
(2) Balance excludes LHFS for which the fair value option was elected.
(3) Loans exclude balances for which the fair value option was elected. At December 31, 2010, long-term debt excludes balances for which the fair value option was elected.
Loans exclude lease financing with a carrying amount of $13.1 billion at both December 31, 2011 and 2010, respectively.
(4) The carrying amount and fair value exclude obligations under capital leases of $116 million and $26 million at December 31, 2011 and 2010, respectively.
Loan commitments, standby letters of credit and commercial
and similar letters of credit are not included in the table above.
A reasonable estimate of the fair value of these instruments is
the carrying value of deferred fees plus the related allowance.
This amounted to $495 million and $673 million at
December 31, 2011 and 2010, respectively.
205