Wells Fargo 2011 Annual Report Download - page 212
Download and view the complete annual report
Please find page 212 of the 2011 Wells Fargo annual report below. You can navigate through the pages in the report by either clicking on the pages listed below, or by using the keyword search tool below to find specific information within the annual report.-
 1
1 -
2
-
3
-
4
-
5
-
6
-
7
-
8
-
9
-
10
-
11
-
12
-
13
-
14
-
15
-
16
-
17
-
18
-
19
-
20
-
21
-
22
-
23
-
24
-
25
-
26
-
27
-
28
-
29
-
30
-
31
-
32
-
33
-
34
-
35
-
36
-
37
-
38
-
39
-
40
-
41
-
42
-
43
-
44
-
45
-
46
-
47
-
48
-
49
-
50
-
51
-
52
-
53
-
54
-
55
-
56
-
57
-
58
-
59
-
60
-
61
-
62
-
63
-
64
-
65
-
66
-
67
-
68
-
69
-
70
-
71
-
72
-
73
-
74
-
75
-
76
-
77
-
78
-
79
-
80
-
81
-
82
-
83
-
84
-
85
-
86
-
87
-
88
-
89
-
90
-
91
-
92
-
93
-
94
-
95
-
96
-
97
-
98
-
99
-
100
-
101
-
102
-
103
-
104
-
105
-
106
-
107
-
108
-
109
-
110
-
111
-
112
-
113
-
114
-
115
-
116
-
117
-
118
-
119
-
120
-
121
-
122
-
123
-
124
-
125
-
126
-
127
-
128
-
129
-
130
-
131
-
132
-
133
-
134
-
135
-
136
-
137
-
138
-
139
-
140
-
141
-
142
-
143
-
144
-
145
-
146
-
147
-
148
-
149
-
150
-
151
-
152
-
153
-
154
-
155
-
156
-
157
-
158
-
159
-
160
-
161
-
162
-
163
-
164
-
165
-
166
-
167
-
168
-
169
-
170
-
171
-
172
-
173
-
174
-
175
-
176
-
177
-
178
-
179
-
180
-
181
-
182
-
183
-
184
-
185
-
186
-
187
-
188
-
189
-
190
-
191
-
192
-
193
-
194
-
195
-
196
-
197
-
198
-
199
-
200
-
201
-
 202
202 -
 203
203 -
 204
204 -
 205
205 -
 206
206 -
 207
207 -
 208
208 -
 209
209 -
 210
210 -
 211
211 -
 212
212 -
 213
213 -
 214
214 -
 215
215 -
 216
216 -
 217
217 -
 218
218 -
 219
219 -
 220
220 -
 221
221 -
 222
222 -
223
-
224
-
225
-
226
-
227
-
228
-
229
-
230
-
231
-
232
-
233
-
234
-
235
-
236
-
237
-
238
-
239
-
240
 |
 |

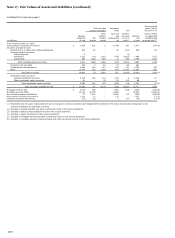
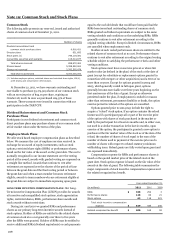
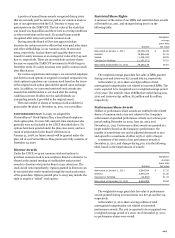
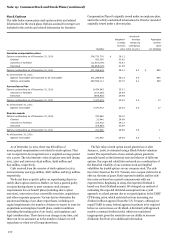
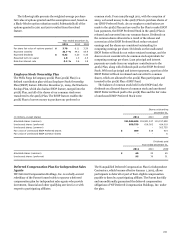
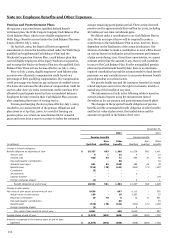
Note 19: Common Stock and Stock Plans (continued)
Stock Options
The table below summarizes stock option activity and related
information for the stock plans. Options assumed in mergers are
included in the activity and related information for Incentive
Compensation Plans if originally issued under an employee plan,
and in the activity and related information for Director Awards if
originally issued under a director plan.
Weighted-
Weighted-
average
Aggregate
average
remaining
intrinsic
exercise
contractual
value
Number
price
term (in yrs.)
(in millions)
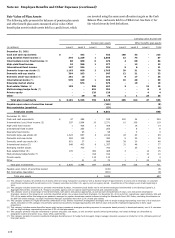
Incentive compensation plans
Options outstanding as of December 31, 2010
306,770,791
$
38.11
Granted
953,308
30.62
Canceled or forfeited
(11,457,278)
73.47
Exercised
(24,968,218)
21.28
Options outstanding as of December 31, 2011
271,298,603
38.14
4.3
$
890
As of December 31, 2011:
Options exercisable and expected to be exercisable
271,298,603
38.14
4.3
890
Options exercisable
245,592,111
40.70
4.1
529
PartnerShares Plan
Options outstanding as of December 31, 2010
8,474,545
25.21
Canceled or forfeited
(137,253)
24.94
Exercised
(859,820)
24.85
Options outstanding as of December 31, 2011
7,477,472
25.25
0.2
17
As of December 31, 2011:
Options exercisable
7,477,472
25.25
0.2
17
Director awards
Options outstanding as of December 31, 2010
797,864
29.10
Granted
21,940
28.68
Canceled or forfeited
(32,412)
29.12
Exercised
(65,960)
23.90
Options outstanding as of December 31, 2011
721,432
29.56
3.6
1
As of December 31, 2011:
Options exercisable
721,432
29.56
3.6
1
As of December 31, 2011, there was $8 million of
unrecognized compensation cost related to stock options. That
cost is expected to be recognized over a weighted-average period
of 0.3 years. The total intrinsic value of options exercised during
2011, 2010 and 2009 was $246 million, $298 million and
$50 million, respectively.
Cash received from the exercise of stock options for 2011,
2010 and 2009 was $554 million, $687 million and $153 million,
respectively.
We do not have a specific policy on repurchasing shares to
satisfy share option exercises. Rather, we have a general policy
on repurchasing shares to meet common stock issuance
requirements for our benefit plans (including share option
exercises), conversion of our convertible securities, acquisitions
and other corporate purposes. Various factors determine the
amount and timing of our share repurchases, including our
capital requirements, the number of shares we expect to issue for
acquisitions and employee benefit plans, market conditions
(including the trading price of our stock), and regulatory and
legal considerations. These factors can change at any time, and
there can be no assurance as to the number of shares we will
repurchase or when we will repurchase them.
The fair value of each option award granted on or after
January 1, 2006, is estimated using a Black-Scholes valuation
model. The expected term of non-reload options granted is
generally based on the historical exercise behavior of full-term
options. Our expected volatilities are based on a combination of
the historical volatility of our common stock and implied
volatilities for traded options on our common stock. The risk-
free rate is based on the U.S. Treasury zero-coupon yield curve in
effect at the time of grant. Both expected volatility and the risk-
free rates are based on a period commensurate with our
expected term. Beginning in 2009, the expected dividend is
based on a fixed dividend amount. We changed our method of
estimating the expected dividend assumption from a yield
approach to a fixed amount due to our participation in the TARP
CPP during 2009, which restricted us from increasing our
dividend without approval from the U.S. Treasury; although we
repaid TARP in 2009, federal approval continues to be required
before we can increase our dividend. A dividend yield approach
models a constant dividend yield, which was considered
inappropriate given the restriction on our ability to increase
dividends. See Note 3 for additional information.
210