Wells Fargo 2011 Annual Report Download - page 61
Download and view the complete annual report
Please find page 61 of the 2011 Wells Fargo annual report below. You can navigate through the pages in the report by either clicking on the pages listed below, or by using the keyword search tool below to find specific information within the annual report.-
 1
1 -
2
-
3
-
4
-
5
-
6
-
7
-
8
-
9
-
10
-
11
-
12
-
13
-
14
-
15
-
16
-
17
-
18
-
19
-
20
-
21
-
22
-
23
-
24
-
25
-
26
-
27
-
28
-
29
-
30
-
31
-
32
-
33
-
34
-
35
-
36
-
37
-
38
-
39
-
40
-
41
-
42
-
43
-
44
-
45
-
46
-
47
-
48
-
49
-
50
-
 51
51 -
 52
52 -
 53
53 -
 54
54 -
 55
55 -
 56
56 -
 57
57 -
 58
58 -
 59
59 -
 60
60 -
 61
61 -
 62
62 -
 63
63 -
 64
64 -
 65
65 -
 66
66 -
 67
67 -
 68
68 -
 69
69 -
 70
70 -
 71
71 -
72
-
73
-
74
-
75
-
76
-
77
-
78
-
79
-
80
-
81
-
82
-
83
-
84
-
85
-
86
-
87
-
88
-
89
-
90
-
91
-
92
-
93
-
94
-
95
-
96
-
97
-
98
-
99
-
100
-
101
-
102
-
103
-
104
-
105
-
106
-
107
-
108
-
109
-
110
-
111
-
112
-
113
-
114
-
115
-
116
-
117
-
118
-
119
-
120
-
121
-
122
-
123
-
124
-
125
-
126
-
127
-
128
-
129
-
130
-
131
-
132
-
133
-
134
-
135
-
136
-
137
-
138
-
139
-
140
-
141
-
142
-
143
-
144
-
145
-
146
-
147
-
148
-
149
-
150
-
151
-
152
-
153
-
154
-
155
-
156
-
157
-
158
-
159
-
160
-
161
-
162
-
163
-
164
-
165
-
166
-
167
-
168
-
169
-
170
-
171
-
172
-
173
-
174
-
175
-
176
-
177
-
178
-
179
-
180
-
181
-
182
-
183
-
184
-
185
-
186
-
187
-
188
-
189
-
190
-
191
-
192
-
193
-
194
-
195
-
196
-
197
-
198
-
199
-
200
-
201
-
202
-
203
-
204
-
205
-
206
-
207
-
208
-
209
-
210
-
211
-
212
-
213
-
214
-
215
-
216
-
217
-
218
-
219
-
220
-
221
-
222
-
223
-
224
-
225
-
226
-
227
-
228
-
229
-
230
-
231
-
232
-
233
-
234
-
235
-
236
-
237
-
238
-
239
-
240
 |
 |

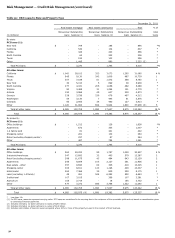
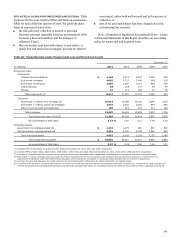
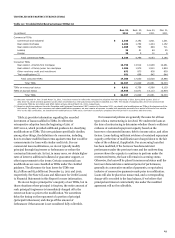
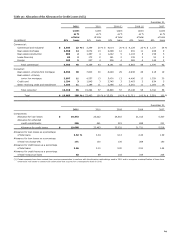
NONACCRUAL LOANS AND FORECLOSED ASSETS (NPAs)
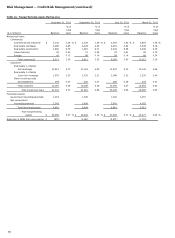
Table
28 shows the five-year trend for NPAs and Table 29 summarizes
NPAs for each of the four quarters of 2011. We generally place
loans on nonaccrual status when:
the full and timely collection of interest or principal
becomes uncertain (generally based on an assessment of the
borrower’s financial condition and the adequacy of
collateral, if any);
they are 90 days (120 days with respect to real estate 1-4
family first and junior lien mortgages) past due for interest
or principal, unless both well-secured and in the process of
collection; or
part of the principal balance has been charged off and no
restructuring has occurred.
Note 1 (Summary of Significant Accounting Policies – Loans)
to Financial Statements in this Report describes our accounting
policy for nonaccrual and impaired loans.
Table 28: Nonperforming Assets (Nonaccrual Loans and Foreclosed Assets)
December 31,
(in millions)
2011
2010
2009
2008
2007
Nonaccrual loans:
Commercial:
Commercial and industrial
$
2,142
3,213
4,397
1,253
432
Real estate mortgage
4,085
5,227
3,696
594
128
Real estate construction
1,890
2,676
3,313
989
293
Lease financing
53
108
171
92
45
Foreign
47
127
146
57
45
Total commercial (1)
8,217
11,351
11,723
2,985
943
Consumer:
Real estate 1-4 family first mortgage (2)
10,913
12,289
10,100
2,648
1,272
Real estate 1-4 family junior lien mortgage
1,975
2,302
2,263
894
280
Other revolving credit and installment
199
300
332
273
184
Total consumer
13,087
14,891
12,695
3,815
1,736
Total nonaccrual loans (3)(4)(5)
21,304
26,242
24,418
6,800
2,679
As a percentage of total loans
2.77
%
3.47
3.12
0.79
0.70
Foreclosed assets:
Government insured/guaranteed (6)
$
1,319
1,479
960
667
535
Non-government insured/guaranteed
3,342
4,530
2,199
1,526
649
Total foreclosed assets
4,661
6,009
3,159
2,193
1,184
Total nonperforming assets
$
25,965
32,251
27,577
8,993
3,863
As a percentage of total loans
3.37
%
4.26
3.52
1.04
1.01
(1)
Includes LHFS of $25 million, $3 million and $27 million at December 31, 2011, 2010 and 2009, respectively.
(2)
Includes MHFS of $301 million, $426 million, $339 million, $193 million and $222 million at December 31, 2011, 2010, 2009, 2008 and 2007, respectively.
(3)
Excludes PCI loans because they continue to earn interest income from accretable yield, independent of performance in accordance with their contractual terms.
(4)
Real estate 1-4 family mortgage loans insured by the FHA or guaranteed by the VA and student loans predominantly guaranteed by agencies on behalf of the U.S.
Department of Education under the Federal Family Education Loan Program are not placed on nonaccrual status because they are insured or guaranteed.
(5)
See Note 6 (Loans and Allowance for Credit Losses) to Financial Statements in this Report for further information on impaired loans.
(6)
Consistent with regulatory reporting requirements, foreclosed real estate securing government insured/guaranteed loans is classified as nonperforming. Both principal and
interest for government insured/guaranteed loans secured by the foreclosed real estate are collectible because the loans are insured by the FHA or guaranteed by the VA.
59