Wells Fargo 2011 Annual Report Download - page 136
Download and view the complete annual report
Please find page 136 of the 2011 Wells Fargo annual report below. You can navigate through the pages in the report by either clicking on the pages listed below, or by using the keyword search tool below to find specific information within the annual report.
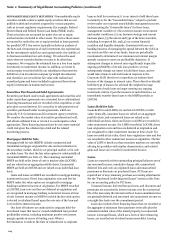
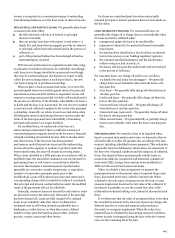
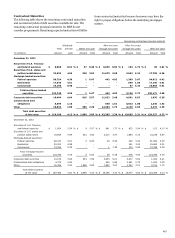
Note 5: Securities Available for Sale (continued)
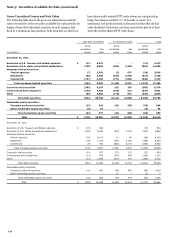
Gross Unrealized Losses and Fair Value
The following table shows the gross unrealized losses and fair
value of securities in the securities available-for-sale portfolio by
length of time that individual securities in each category had
been in a continuous loss position. Debt securities on which we
have taken credit-related OTTI write-downs are categorized as
being “less than 12 months” or “12 months or more” in a
continuous loss position based on the point in time that the fair
value declined to below the cost basis and not the period of time
since the credit-related OTTI write-down.
Less than 12 months
12 months or more
Total
Gross
Gross
Gross
unrealized
Fair
unrealized
Fair
unrealized
Fair
(in millions)
losses
value
losses
value
losses
value
December 31, 2011
Securities of U.S. Treasury and federal agencies
$
(11)
5,473
-
-
(11)
5,473
Securities of U.S. states and political subdivisions
(229)
8,501
(654)
4,348
(883)
12,849
Mortgage-backed securities:
Federal agencies
(7)
2,392
(3)
627
(10)
3,019
Residential
(80)
3,780
(334)
3,440
(414)
7,220
Commercial
(157)
3,183
(771)
3,964
(928)
7,147
Total mortgage-backed securities
(244)
9,355
(1,108)
8,031
(1,352)
17,386
Corporate debt securities
(205)
8,107
(81)
167
(286)
8,274
Collateralized debt obligations
(150)
4,268
(199)
613
(349)
4,881
Other
(55)
3,002
(170)
841
(225)
3,843
Total debt securities
(894)
38,706
(2,212)
14,000
(3,106)
52,706
Marketable equity securities:
Perpetual preferred securities
(13)
316
(41)
530
(54)
846
Other marketable equity securities
(9)
61
-
-
(9)
61
Total marketable equity securities
(22)
377
(41)
530
(63)
907
Total
$
(916)
39,083
(2,253)
14,530
(3,169)
53,613
December 31, 2010
Securities of U.S. Treasury and federal agencies
$
(15)
544
-
-
(15)
544
Securities of U.S. states and political subdivisions
(322)
6,242
(515)
2,720
(837)
8,962
Mortgage-backed securities:
Federal agencies
(95)
8,103
(1)
60
(96)
8,163
Residential
(35)
1,023
(454)
4,440
(489)
5,463
Commercial
(9)
441
(626)
5,141
(635)
5,582
Total mortgage-backed securities
(139)
9,567
(1,081)
9,641
(1,220)
19,208
Corporate debt securities
(10)
477
(27)
157
(37)
634
Collateralized debt obligations
(13)
679
(216)
456
(229)
1,135
Other
(13)
1,985
(270)
757
(283)
2,742
Total debt securities
(512)
19,494
(2,109)
13,731
(2,621)
33,225
Marketable equity securities:
Perpetual preferred securities
(41)
962
(48)
467
(89)
1,429
Other marketable equity securities
-
-
(1)
7
(1)
7
Total marketable equity securities
(41)
962
(49)
474
(90)
1,436
Total
$
(553)
20,456
(2,158)
14,205
(2,711)
34,661
134


