Wells Fargo 2011 Annual Report Download - page 174
Download and view the complete annual report
Please find page 174 of the 2011 Wells Fargo annual report below. You can navigate through the pages in the report by either clicking on the pages listed below, or by using the keyword search tool below to find specific information within the annual report.-
 1
1 -
 2
2 -
 3
3 -
 4
4 -
 5
5 -
 6
6 -
 7
7 -
 8
8 -
 9
9 -
 10
10 -
 11
11 -
 12
12 -
 13
13 -
 14
14 -
 15
15 -
 16
16 -
 17
17 -
 18
18 -
 19
19 -
 20
20 -
 21
21 -
 22
22 -
 23
23 -
 24
24 -
 25
25 -
 26
26 -
 27
27 -
 28
28 -
 29
29 -
 30
30 -
 31
31 -
 32
32 -
 33
33 -
 34
34 -
 35
35 -
 36
36 -
 37
37 -
 38
38 -
 39
39 -
 40
40 -
 41
41 -
 42
42 -
 43
43 -
 44
44 -
 45
45 -
 46
46 -
 47
47 -
 48
48 -
 49
49 -
 50
50 -
 51
51 -
 52
52 -
 53
53 -
 54
54 -
 55
55 -
 56
56 -
 57
57 -
 58
58 -
 59
59 -
 60
60 -
 61
61 -
 62
62 -
 63
63 -
 64
64 -
 65
65 -
 66
66 -
 67
67 -
 68
68 -
 69
69 -
 70
70 -
 71
71 -
 72
72 -
 73
73 -
 74
74 -
 75
75 -
 76
76 -
 77
77 -
 78
78 -
 79
79 -
 80
80 -
 81
81 -
 82
82 -
 83
83 -
 84
84 -
 85
85 -
 86
86 -
 87
87 -
 88
88 -
 89
89 -
 90
90 -
 91
91 -
 92
92 -
 93
93 -
 94
94 -
 95
95 -
 96
96 -
 97
97 -
 98
98 -
 99
99 -
 100
100 -
 101
101 -
 102
102 -
 103
103 -
 104
104 -
 105
105 -
 106
106 -
 107
107 -
 108
108 -
 109
109 -
 110
110 -
 111
111 -
 112
112 -
 113
113 -
 114
114 -
 115
115 -
 116
116 -
 117
117 -
 118
118 -
 119
119 -
 120
120 -
 121
121 -
 122
122 -
 123
123 -
 124
124 -
 125
125 -
 126
126 -
 127
127 -
 128
128 -
 129
129 -
 130
130 -
 131
131 -
 132
132 -
 133
133 -
 134
134 -
 135
135 -
 136
136 -
 137
137 -
 138
138 -
 139
139 -
 140
140 -
 141
141 -
 142
142 -
 143
143 -
 144
144 -
 145
145 -
 146
146 -
 147
147 -
 148
148 -
 149
149 -
 150
150 -
 151
151 -
 152
152 -
 153
153 -
 154
154 -
 155
155 -
 156
156 -
 157
157 -
 158
158 -
 159
159 -
 160
160 -
 161
161 -
 162
162 -
 163
163 -
 164
164 -
 165
165 -
 166
166 -
 167
167 -
 168
168 -
 169
169 -
 170
170 -
 171
171 -
 172
172 -
 173
173 -
 174
174 -
 175
175 -
 176
176 -
 177
177 -
 178
178 -
 179
179 -
 180
180 -
 181
181 -
 182
182 -
 183
183 -
 184
184 -
 185
185 -
 186
186 -
 187
187 -
 188
188 -
 189
189 -
 190
190 -
 191
191 -
 192
192 -
 193
193 -
 194
194 -
 195
195 -
 196
196 -
 197
197 -
 198
198 -
 199
199 -
 200
200 -
 201
201 -
 202
202 -
 203
203 -
 204
204 -
 205
205 -
 206
206 -
 207
207 -
 208
208 -
 209
209 -
 210
210 -
 211
211 -
 212
212 -
 213
213 -
 214
214 -
 215
215 -
 216
216 -
 217
217 -
 218
218 -
 219
219 -
 220
220 -
 221
221 -
 222
222 -
 223
223 -
 224
224 -
 225
225 -
 226
226 -
 227
227 -
 228
228 -
 229
229 -
 230
230 -
 231
231 -
 232
232 -
 233
233 -
 234
234 -
 235
235 -
 236
236 -
 237
237 -
 238
238 -
 239
239 -
 240
240
 |
 |

Note 9: Mortgage Banking Activities (continued)
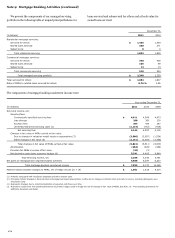
We present the components of our managed servicing
portfolio in the following table at unpaid principal balance for
loans serviced and subserviced for others and at book value for
owned loans serviced.
December 31,
(in billions)
2011
2010
Residential mortgage servicing:
Serviced for others
$
1,456
1,429
Owned loans serviced
358
371
Subservicing
8
9
Total residential servicing
1,822
1,809
Commercial mortgage servicing:
Serviced for others
398
408
Owned loans serviced
106
99
Subservicing
14
13
Total commercial servicing
518
520
Total managed servicing portfolio
$
2,340
2,329
Total serviced for others
$
1,854
1,837
Ratio of MSRs to related loans serviced for others
0.76
%
0.86
The components of mortgage banking noninterest income were:
Year ended December 31,
(in millions)
2011
2010
2009
Servicing income, net:
Servicing fees:
Contractually specified servicing fees
$
4,611
4,566
4,473
Late charges
298
360
330
Ancillary fees
354
434
287
Unreimbursed direct servicing costs (1)
(1,119)
(763)
(914)
Net servicing fees
4,144
4,597
4,176
Changes in fair value of MSRs carried at fair value:
Due to changes in valuation model inputs or assumptions (2)
(3,680)
(2,957)
(1,534)
Other changes in fair value (3)
(2,141)
(2,554)
(3,436)
Total changes in fair value of MSRs carried at fair value
(5,821)
(5,511)
(4,970)
Amortization
(264)
(228)
(264)
Provision for MSRs in excess of fair value
(34)
(3)
-
Net derivative gains from economic hedges (4)
5,241
4,485
6,849
Total servicing income, net
3,266
3,340
5,791
Net gains on mortgage loan origination/sales activities
4,566
6,397
6,237
Total mortgage banking noninterest income
$
7,832
9,737
12,028
Market-related valuation changes to MSRs, net of hedge results (2) + (4)
$
1,561
1,528
5,315
(1) Primarily associated with foreclosure expenses and other interest costs.
(2) Principally reflects changes in discount rates and prepayment speed assumptions, mostly due to changes in interest rates and costs to service, including delinquency and
foreclosure costs.
(3) Represents changes due to collection/realization of expected cash flows over time.
(4) Represents results from free-standing derivatives (economic hedges) used to hedge the risk of changes in fair value of MSRs. See Note 16 – Free-Standing Derivatives for
additional discussion and detail.
172
