Wells Fargo 2011 Annual Report Download - page 161
Download and view the complete annual report
Please find page 161 of the 2011 Wells Fargo annual report below. You can navigate through the pages in the report by either clicking on the pages listed below, or by using the keyword search tool below to find specific information within the annual report.-
 1
1 -
2
-
3
-
4
-
5
-
6
-
7
-
8
-
9
-
10
-
11
-
12
-
13
-
14
-
15
-
16
-
17
-
18
-
19
-
20
-
21
-
22
-
23
-
24
-
25
-
26
-
27
-
28
-
29
-
30
-
31
-
32
-
33
-
34
-
35
-
36
-
37
-
38
-
39
-
40
-
41
-
42
-
43
-
44
-
45
-
46
-
47
-
48
-
49
-
50
-
51
-
52
-
53
-
54
-
55
-
56
-
57
-
58
-
59
-
60
-
61
-
62
-
63
-
64
-
65
-
66
-
67
-
68
-
69
-
70
-
71
-
72
-
73
-
74
-
75
-
76
-
77
-
78
-
79
-
80
-
81
-
82
-
83
-
84
-
85
-
86
-
87
-
88
-
89
-
90
-
91
-
92
-
93
-
94
-
95
-
96
-
97
-
98
-
99
-
100
-
101
-
102
-
103
-
104
-
105
-
106
-
107
-
108
-
109
-
110
-
111
-
112
-
113
-
114
-
115
-
116
-
117
-
118
-
119
-
120
-
121
-
122
-
123
-
124
-
125
-
126
-
127
-
128
-
129
-
130
-
131
-
132
-
133
-
134
-
135
-
136
-
137
-
138
-
139
-
140
-
141
-
142
-
143
-
144
-
145
-
146
-
147
-
148
-
149
-
150
-
 151
151 -
 152
152 -
 153
153 -
 154
154 -
 155
155 -
 156
156 -
 157
157 -
 158
158 -
 159
159 -
 160
160 -
 161
161 -
 162
162 -
 163
163 -
 164
164 -
 165
165 -
 166
166 -
 167
167 -
 168
168 -
 169
169 -
 170
170 -
 171
171 -
172
-
173
-
174
-
175
-
176
-
177
-
178
-
179
-
180
-
181
-
182
-
183
-
184
-
185
-
186
-
187
-
188
-
189
-
190
-
191
-
192
-
193
-
194
-
195
-
196
-
197
-
198
-
199
-
200
-
201
-
202
-
203
-
204
-
205
-
206
-
207
-
208
-
209
-
210
-
211
-
212
-
213
-
214
-
215
-
216
-
217
-
218
-
219
-
220
-
221
-
222
-
223
-
224
-
225
-
226
-
227
-
228
-
229
-
230
-
231
-
232
-
233
-
234
-
235
-
236
-
237
-
238
-
239
-
240
 |
 |

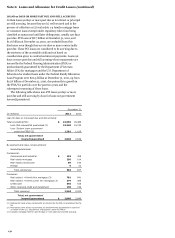
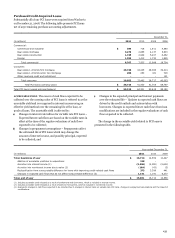
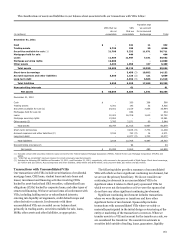
Note 7: Premises, Equipment, Lease Commitments and Other Assets
December 31,
(in millions)
2011
2010
Land
$
1,825
1,825
Buildings
7,441
7,440
Furniture and equipment
7,195
6,689
Leasehold improvements
1,725
1,683
Premises and equipment leased
under capital leases
147
148
Total premises and equipment
18,333
17,785
Less: Accumulated depreciation
and amortization
8,802
8,141
Net book value,
premises and equipment
$
9,531
9,644
Depreciation and amortization expense for premises and
equipment was $1.4 billion, $1.5 billion and $1.3 billion in 2011,
2010 and 2009, respectively.
Dispositions of premises and equipment, included in
noninterest expense, resulted in net losses of $17 million,
$115 million and $22 million in 2011, 2010 and 2009,
respectively.
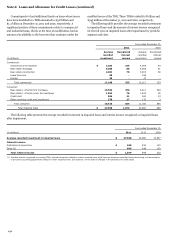
We have obligations under a number of noncancelable
operating leases for premises and equipment. The terms of these
leases are predominantly up to 15 years, with the longest up to
94 years, and many provide for periodic adjustment of rentals
based on changes in various economic indicators. Some leases
also include a renewal option. The following table provides the
future minimum payments under capital leases and
noncancelable operating leases, net of sublease rentals, with
terms greater than one year as of December 31, 2011.
Operating
Capital
(in millions)
leases
leases
Year ended December 31,
2012
$
1,319
54
2013
1,216
55
2014
1,075
3
2015
872
3
2016
717
3
Thereafter
3,239
17
Total minimum lease payments
$
8,438
135
Executory costs
$
(9)
Amounts representing interest
(10)
Present value of net minimum
lease payments
$
116
Operating lease rental expense (predominantly for premises),
net of rental income, was $1.2 billion, $1.3 billion and
$1.4 billion in 2011, 2010 and 2009, respectively.
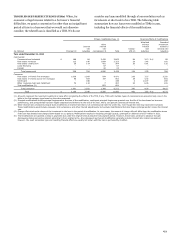
The components of other assets were:
December 31,
(in millions)
2011
2010
Nonmarketable equity investments:
Cost method:
Private equity investments
$
3,444
3,240
Federal bank stock
4,617
5,254
Total cost method
8,061
8,494
LIHTC investments - equity method (1)
4,077
3,611
All other equity method
4,434
4,013
Principal investments (2)
236
305
Total nonmarketable
equity investments
16,808
16,423
Corporate/bank-owned life insurance
20,146
19,845
Accounts receivable
25,939
23,763
Interest receivable
5,296
4,895
Core deposit intangibles
7,311
8,904
Customer relationship and
other amortized intangibles
1,639
1,847
Foreclosed assets:
GNMA (3)
1,319
1,479
Other
3,342
4,530
Operating lease assets
1,825
1,873
Due from customers on acceptances
225
229
Other
17,172
15,993
Total other assets
$
101,022
99,781
(1)
Represents low income housing tax credit investments.
(2) Principal investments are recorded at fair value with realized and unrealized
gains (losses) included in net gains (losses) from equity investments in the
income statement.
(3) These are foreclosed real estate securing FHA insured and VA guaranteed loans.
Both principal and interest for these loans secured by the foreclosed real estate
are collectible because they are insured/guaranteed.
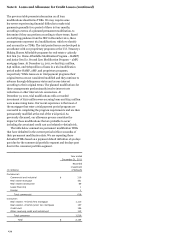
Income related to nonmarketable equity investments was:
Year ended December 31,
(in millions)
2011
2010
2009
Net gains (losses) from:
Private equity investments
$
813
492
(368)
Principal investments
29
42
79
All other nonmarketable
equity investments
(298)
(188)
(234)
Total
$
544
346
(523)
159