Wells Fargo 2011 Annual Report Download - page 45
Download and view the complete annual report
Please find page 45 of the 2011 Wells Fargo annual report below. You can navigate through the pages in the report by either clicking on the pages listed below, or by using the keyword search tool below to find specific information within the annual report.-
 1
1 -
2
-
3
-
4
-
5
-
6
-
7
-
8
-
9
-
10
-
11
-
12
-
13
-
14
-
15
-
16
-
17
-
18
-
19
-
20
-
21
-
22
-
23
-
24
-
25
-
26
-
27
-
28
-
29
-
30
-
31
-
32
-
33
-
34
-
 35
35 -
 36
36 -
 37
37 -
 38
38 -
 39
39 -
 40
40 -
 41
41 -
 42
42 -
 43
43 -
 44
44 -
 45
45 -
 46
46 -
 47
47 -
 48
48 -
 49
49 -
 50
50 -
 51
51 -
 52
52 -
 53
53 -
 54
54 -
 55
55 -
56
-
57
-
58
-
59
-
60
-
61
-
62
-
63
-
64
-
65
-
66
-
67
-
68
-
69
-
70
-
71
-
72
-
73
-
74
-
75
-
76
-
77
-
78
-
79
-
80
-
81
-
82
-
83
-
84
-
85
-
86
-
87
-
88
-
89
-
90
-
91
-
92
-
93
-
94
-
95
-
96
-
97
-
98
-
99
-
100
-
101
-
102
-
103
-
104
-
105
-
106
-
107
-
108
-
109
-
110
-
111
-
112
-
113
-
114
-
115
-
116
-
117
-
118
-
119
-
120
-
121
-
122
-
123
-
124
-
125
-
126
-
127
-
128
-
129
-
130
-
131
-
132
-
133
-
134
-
135
-
136
-
137
-
138
-
139
-
140
-
141
-
142
-
143
-
144
-
145
-
146
-
147
-
148
-
149
-
150
-
151
-
152
-
153
-
154
-
155
-
156
-
157
-
158
-
159
-
160
-
161
-
162
-
163
-
164
-
165
-
166
-
167
-
168
-
169
-
170
-
171
-
172
-
173
-
174
-
175
-
176
-
177
-
178
-
179
-
180
-
181
-
182
-
183
-
184
-
185
-
186
-
187
-
188
-
189
-
190
-
191
-
192
-
193
-
194
-
195
-
196
-
197
-
198
-
199
-
200
-
201
-
202
-
203
-
204
-
205
-
206
-
207
-
208
-
209
-
210
-
211
-
212
-
213
-
214
-
215
-
216
-
217
-
218
-
219
-
220
-
221
-
222
-
223
-
224
-
225
-
226
-
227
-
228
-
229
-
230
-
231
-
232
-
233
-
234
-
235
-
236
-
237
-
238
-
239
-
240
 |
 |

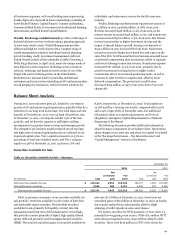
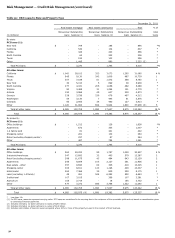
Loan Portfolio
Total loans were $769.6 billion at December 31, 2011, up
$12.4 billion from December 31, 2010. Table 12 provides a
summarized breakdown by loan portfolio. Increased balances in
many commercial loan portfolios more than offset the continued
reduction in the non-strategic and liquidating loan portfolios,
which have declined $21.0 billion since December 31, 2010, as
well as the soft demand in consumer loans in response to
economic conditions. Additional information on the non-
strategic and liquidating loan portfolios is included in Table 17 in
the “Credit Risk Management” section of this Report.
Many loan portfolios had double-digit year-over-year loan
growth in average balances, including government and
institutional banking, asset-backed finance, capital finance,
commercial banking, commercial real estate, international and
real estate capital markets. Included in the growth of loans from
year end 2010 were loan purchases in 2011 with a period end
balance of $3.6 billion of U.S.-based commercial real estate.
Consumer loans include the consolidation of $5.6 billion of
reverse mortgage loans previously sold.
Table 12: Loan Portfolios
December 31,
(in millions)
2011
2010
2009
2008
2007
Commercial
$
345,450
322,058
336,465
389,964
160,282
Consumer
424,181
435,209
446,305
474,866
221,913
Total loans
$
769,631
757,267
782,770
864,830
382,195
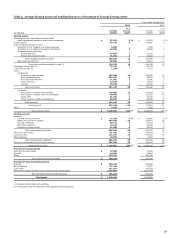
A discussion of average loan balances and a comparative
detail of average loan balances is included in Table 5 under
“Earnings Performance – Net Interest Income” earlier in this
Report. Year-end balances and other loan related information
are in Note 6 (Loans and Allowance for Credit Losses) to
Financial Statements in this Report.
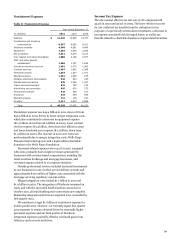
Table 13 shows contractual loan maturities for selected loan
categories and sensitivities of those loans to changes in interest
rates.
Table 13: Maturities for Selected Loan Categories
December 31,
2011
2010
After
After
Within
one year
After
Within
one year
After
one
through
five
one
through
five
(in millions)
year
five years
years
Total
year
five years
years
Total
Selected loan maturities:
Commercial and industrial
$
44,258
101,273
21,685
167,216
39,576
90,497
21,211
151,284
Real estate mortgage
22,537
54,201
29,237
105,975
27,544
44,627
27,264
99,435
Real estate construction
10,059
8,178
1,145
19,382
15,009
9,189
1,135
25,333
Foreign
35,258
3,142
1,360
39,760
25,087
5,508
2,317
32,912
Total selected loans
$
112,112
166,794
53,427
332,333
107,216
149,821
51,927
308,964
Distribution of loans due
after one year to
changes in interest rates:
Loans at fixed
interest rates
$
19,319
13,712
29,886
14,543
Loans at floating/variable
interest rates
147,475
39,715
119,935
37,384
Total selected loans
$
166,794
53,427
149,821
51,927
43