Wells Fargo 2011 Annual Report Download - page 221
Download and view the complete annual report
Please find page 221 of the 2011 Wells Fargo annual report below. You can navigate through the pages in the report by either clicking on the pages listed below, or by using the keyword search tool below to find specific information within the annual report.-
 1
1 -
2
-
3
-
4
-
5
-
6
-
7
-
8
-
9
-
10
-
11
-
12
-
13
-
14
-
15
-
16
-
17
-
18
-
19
-
20
-
21
-
22
-
23
-
24
-
25
-
26
-
27
-
28
-
29
-
30
-
31
-
32
-
33
-
34
-
35
-
36
-
37
-
38
-
39
-
40
-
41
-
42
-
43
-
44
-
45
-
46
-
47
-
48
-
49
-
50
-
51
-
52
-
53
-
54
-
55
-
56
-
57
-
58
-
59
-
60
-
61
-
62
-
63
-
64
-
65
-
66
-
67
-
68
-
69
-
70
-
71
-
72
-
73
-
74
-
75
-
76
-
77
-
78
-
79
-
80
-
81
-
82
-
83
-
84
-
85
-
86
-
87
-
88
-
89
-
90
-
91
-
92
-
93
-
94
-
95
-
96
-
97
-
98
-
99
-
100
-
101
-
102
-
103
-
104
-
105
-
106
-
107
-
108
-
109
-
110
-
111
-
112
-
113
-
114
-
115
-
116
-
117
-
118
-
119
-
120
-
121
-
122
-
123
-
124
-
125
-
126
-
127
-
128
-
129
-
130
-
131
-
132
-
133
-
134
-
135
-
136
-
137
-
138
-
139
-
140
-
141
-
142
-
143
-
144
-
145
-
146
-
147
-
148
-
149
-
150
-
151
-
152
-
153
-
154
-
155
-
156
-
157
-
158
-
159
-
160
-
161
-
162
-
163
-
164
-
165
-
166
-
167
-
168
-
169
-
170
-
171
-
172
-
173
-
174
-
175
-
176
-
177
-
178
-
179
-
180
-
181
-
182
-
183
-
184
-
185
-
186
-
187
-
188
-
189
-
190
-
191
-
192
-
193
-
194
-
195
-
196
-
197
-
198
-
199
-
200
-
201
-
202
-
203
-
204
-
205
-
206
-
207
-
208
-
209
-
210
-
 211
211 -
 212
212 -
 213
213 -
 214
214 -
 215
215 -
 216
216 -
 217
217 -
 218
218 -
 219
219 -
 220
220 -
 221
221 -
 222
222 -
 223
223 -
 224
224 -
 225
225 -
 226
226 -
 227
227 -
 228
228 -
 229
229 -
 230
230 -
 231
231 -
232
-
233
-
234
-
235
-
236
-
237
-
238
-
239
-
240
 |
 |

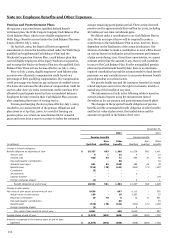
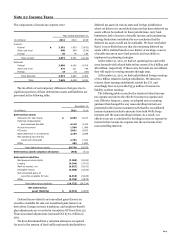
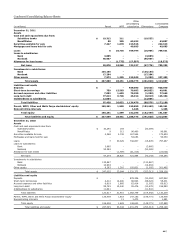
Note 21: Income Taxes
The components of income tax expense were:
Year ended December 31,
(in millions)
2011
2010
2009
Current:
Federal
$
3,352
1,425
(3,952)
State and local
468
548
(334)
Foreign
52
78
164
Total current
3,872
2,051
(4,122)
Deferred:
Federal
3,088
4,060
8,709
State and local
471
211
794
Foreign
14
16
(50)
Total deferred
3,573
4,287
9,453
Total
$
7,445
6,338
5,331
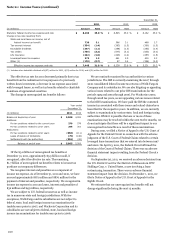
The tax effects of our temporary differences that gave rise to
significant portions of these deferred tax assets and liabilities are
presented in the following table.
December 31,
(in millions)
2011
2010
Deferred tax assets
Allowance for loan losses
$
6,955
8,157
Deferred compensation
and employee benefits
4,115
3,473
Accrued expenses
1,598
1,989
PCI loans
3,851
4,933
Basis difference in investments
2,104
2,598
Net operating loss and tax
credit carry forwards
1,701
1,514
Other
402
1,891
Total deferred tax assets
20,726
24,555
Deferred tax assets valuation allowance
(918)
(711)
Deferred tax liabilities
Mortgage servicing rights
(7,388)
(8,020)
Leasing
(4,344)
(3,703)
Mark to market, net
(4,027)
(5,161)
Intangible assets
(2,608)
(3,322)
Net unrealized gains on
securities available for sale
(2,619)
(3,243)
Other
(3,736)
(2,875)
Total deferred tax liabilities
(24,722)
(26,324)
Net deferred tax
asset (liability)
$
(4,914)
(2,480)
Deferred taxes related to net unrealized gains (losses) on
securities available for sale, net unrealized gains (losses) on
derivatives, foreign currency translation, and employee benefit
plan adjustments are recorded in cumulative OCI (see Note 23).
These associated adjustments increased OCI by $1.1 billion in
2011.
We have determined that a valuation allowance is required
for 2011 in the amount of $918 million primarily attributable to
deferred tax assets in various state and foreign jurisdictions
where we believe it is more likely than not that these deferred tax
assets will not be realized. In these jurisdictions, carry back
limitations, lack of sources of taxable income, and tax planning
strategy limitations contributed to our conclusion that the
deferred tax assets would not be realizable. We have concluded
that it is more likely than not that the remaining deferred tax
assets will be realized based on our history of earnings, sources
of taxable income in carry back periods, and our ability to
implement tax planning strategies.
At December 31, 2011, we had net operating loss and credit
carry forwards with related deferred tax assets of $1.6 billion and
$81 million, respectively. If these carry forwards are not utilized,
they will expire in varying amounts through 2031.
At December 31, 2011, we had undistributed foreign earnings
of $1.2 billion related to foreign subsidiaries. We intend to
reinvest these earnings indefinitely outside the U.S. and
accordingly have not provided $339 million of income tax
liability on these earnings.
The following table reconciles the statutory federal income
tax expense and rate to the effective income tax expense and
rate. Effective January 1, 2009, we adopted new accounting
guidance that changed the way noncontrolling interests are
presented in the income statement such that the consolidated
income statement includes amounts from both Wells Fargo
interests and the noncontrolling interests. As a result, our
effective tax rate is calculated by dividing income tax expense by
income before income tax expense less the net income from
noncontrolling interests.
219