Wells Fargo 2011 Annual Report Download - page 35
Download and view the complete annual report
Please find page 35 of the 2011 Wells Fargo annual report below. You can navigate through the pages in the report by either clicking on the pages listed below, or by using the keyword search tool below to find specific information within the annual report.-
 1
1 -
2
-
3
-
4
-
5
-
6
-
7
-
8
-
9
-
10
-
11
-
12
-
13
-
14
-
15
-
16
-
17
-
18
-
19
-
20
-
21
-
22
-
23
-
24
-
 25
25 -
 26
26 -
 27
27 -
 28
28 -
 29
29 -
 30
30 -
 31
31 -
 32
32 -
 33
33 -
 34
34 -
 35
35 -
 36
36 -
 37
37 -
 38
38 -
 39
39 -
 40
40 -
 41
41 -
 42
42 -
 43
43 -
 44
44 -
 45
45 -
46
-
47
-
48
-
49
-
50
-
51
-
52
-
53
-
54
-
55
-
56
-
57
-
58
-
59
-
60
-
61
-
62
-
63
-
64
-
65
-
66
-
67
-
68
-
69
-
70
-
71
-
72
-
73
-
74
-
75
-
76
-
77
-
78
-
79
-
80
-
81
-
82
-
83
-
84
-
85
-
86
-
87
-
88
-
89
-
90
-
91
-
92
-
93
-
94
-
95
-
96
-
97
-
98
-
99
-
100
-
101
-
102
-
103
-
104
-
105
-
106
-
107
-
108
-
109
-
110
-
111
-
112
-
113
-
114
-
115
-
116
-
117
-
118
-
119
-
120
-
121
-
122
-
123
-
124
-
125
-
126
-
127
-
128
-
129
-
130
-
131
-
132
-
133
-
134
-
135
-
136
-
137
-
138
-
139
-
140
-
141
-
142
-
143
-
144
-
145
-
146
-
147
-
148
-
149
-
150
-
151
-
152
-
153
-
154
-
155
-
156
-
157
-
158
-
159
-
160
-
161
-
162
-
163
-
164
-
165
-
166
-
167
-
168
-
169
-
170
-
171
-
172
-
173
-
174
-
175
-
176
-
177
-
178
-
179
-
180
-
181
-
182
-
183
-
184
-
185
-
186
-
187
-
188
-
189
-
190
-
191
-
192
-
193
-
194
-
195
-
196
-
197
-
198
-
199
-
200
-
201
-
202
-
203
-
204
-
205
-
206
-
207
-
208
-
209
-
210
-
211
-
212
-
213
-
214
-
215
-
216
-
217
-
218
-
219
-
220
-
221
-
222
-
223
-
224
-
225
-
226
-
227
-
228
-
229
-
230
-
231
-
232
-
233
-
234
-
235
-
236
-
237
-
238
-
239
-
240
 |
 |
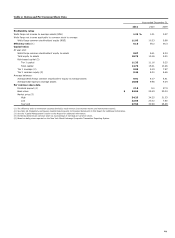
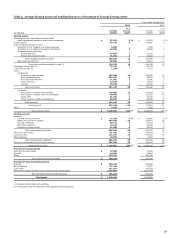
Table 4: Average Earning Assets and Funding Sources as a Percentage of Average Earning Assets
Year ended December 31,
2011
2010
% of
% of
Average
earning
Average
earning
(in millions)
balance
assets
balance
assets
Earning assets
Federal funds sold, securities purchased under
resale agreements and other short-term investments
$
87,186
8
%
$
62,961
6
%
Trading assets
39,737
4
29,920
3
Debt securities available for sale:
Securities of U.S. Treasury and federal agencies
5,503
-
1,870
-
Securities of U.S. states and political subdivisions
24,035
2
16,089
2
Mortgage-backed securities:
Federal agencies
74,665
7
71,953
7
Residential and commercial
31,902
3
31,815
3
Total mortgage-backed securities
106,567
10
103,768
10
Other debt securities (1)
38,625
4
32,611
3
Total debt securities available for sale (1)
174,730
16
154,338
15
Mortgages held for sale (2)
37,232
3
36,716
3
Loans held for sale (2)
1,104
-
3,773
-
Loans:
Commercial:
Commercial and industrial
157,608
15
149,576
14
Real estate mortgage
102,236
9
98,497
9
Real estate construction
21,592
2
31,286
3
Lease financing
12,944
1
13,451
1
Foreign
36,768
3
29,726
3
Total commercial
331,148
30
322,536
30
Consumer:
Real estate 1-4 family first mortgage
226,980
21
235,568
22
Real estate 1-4 family junior lien mortgage
90,705
8
101,537
10
Credit card
21,463
2
22,375
2
Other revolving credit and installment
86,848
8
88,585
8
Total consumer
425,996
39
448,065
42
Total loans (2)
757,144
69
770,601
72
Other
4,929
-
5,849
1
Total earning assets
$
1,102,062
100
%
$
1,064,158
100
%
Funding sources
Deposits:
Interest-bearing checking
$
47,705
4
%
$
60,941
6
%
Market rate and other savings
464,450
42
416,877
39
Savings certificates
69,711
6
87,133
8
Other time deposits
13,126
1
14,654
1
Deposits in foreign offices
61,566
6
55,097
5
Total interest-bearing deposits
656,558
59
634,702
59
Short-term borrowings
51,781
5
46,824
4
Long-term debt
141,079
13
185,426
18
Other liabilities
10,955
1
6,863
1
Total interest-bearing liabilities
860,373
78
873,815
82
Portion of noninterest-bearing funding sources
241,689
22
190,343
18
Total funding sources
$
1,102,062
100
%
$
1,064,158
100
%
Noninterest-earning assets
Cash and due from banks
$
17,388
17,618
Goodwill
24,904
24,824
Other
125,911
120,338
Total noninterest-earning assets
$
168,203
162,780
Noninterest-bearing funding sources
Deposits
$
215,242
183,008
Other liabilities
57,399
47,877
Total equity
137,251
122,238
Noninterest-bearing funding sources used to fund earning assets
(241,689)
(190,343)
Net noninterest-bearing funding sources
$
168,203
162,780
Total assets
$
1,270,265
1,226,938
(1)
Includes certain preferred securities.
(2)
Nonaccrual loans are included in their respective loan categories.
33