Wells Fargo 2011 Annual Report Download - page 143
Download and view the complete annual report
Please find page 143 of the 2011 Wells Fargo annual report below. You can navigate through the pages in the report by either clicking on the pages listed below, or by using the keyword search tool below to find specific information within the annual report.-
 1
1 -
2
-
3
-
4
-
5
-
6
-
7
-
8
-
9
-
10
-
11
-
12
-
13
-
14
-
15
-
16
-
17
-
18
-
19
-
20
-
21
-
22
-
23
-
24
-
25
-
26
-
27
-
28
-
29
-
30
-
31
-
32
-
33
-
34
-
35
-
36
-
37
-
38
-
39
-
40
-
41
-
42
-
43
-
44
-
45
-
46
-
47
-
48
-
49
-
50
-
51
-
52
-
53
-
54
-
55
-
56
-
57
-
58
-
59
-
60
-
61
-
62
-
63
-
64
-
65
-
66
-
67
-
68
-
69
-
70
-
71
-
72
-
73
-
74
-
75
-
76
-
77
-
78
-
79
-
80
-
81
-
82
-
83
-
84
-
85
-
86
-
87
-
88
-
89
-
90
-
91
-
92
-
93
-
94
-
95
-
96
-
97
-
98
-
99
-
100
-
101
-
102
-
103
-
104
-
105
-
106
-
107
-
108
-
109
-
110
-
111
-
112
-
113
-
114
-
115
-
116
-
117
-
118
-
119
-
120
-
121
-
122
-
123
-
124
-
125
-
126
-
127
-
128
-
129
-
130
-
131
-
132
-
 133
133 -
 134
134 -
 135
135 -
 136
136 -
 137
137 -
 138
138 -
 139
139 -
 140
140 -
 141
141 -
 142
142 -
 143
143 -
 144
144 -
 145
145 -
 146
146 -
 147
147 -
 148
148 -
 149
149 -
 150
150 -
 151
151 -
 152
152 -
 153
153 -
154
-
155
-
156
-
157
-
158
-
159
-
160
-
161
-
162
-
163
-
164
-
165
-
166
-
167
-
168
-
169
-
170
-
171
-
172
-
173
-
174
-
175
-
176
-
177
-
178
-
179
-
180
-
181
-
182
-
183
-
184
-
185
-
186
-
187
-
188
-
189
-
190
-
191
-
192
-
193
-
194
-
195
-
196
-
197
-
198
-
199
-
200
-
201
-
202
-
203
-
204
-
205
-
206
-
207
-
208
-
209
-
210
-
211
-
212
-
213
-
214
-
215
-
216
-
217
-
218
-
219
-
220
-
221
-
222
-
223
-
224
-
225
-
226
-
227
-
228
-
229
-
230
-
231
-
232
-
233
-
234
-
235
-
236
-
237
-
238
-
239
-
240
 |
 |

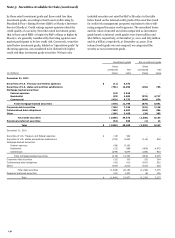
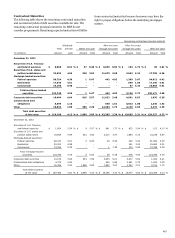
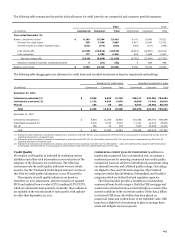
Note 6: Loans and Allowance for Credit Losses
The following table presents total loans outstanding by portfolio
segment and class of financing receivable. Outstanding balances
include a total net reduction of $9.3 billion and $11.3 billion at
December 31, 2011 and 2010, respectively, for unearned income,
net deferred loan fees, and unamortized discounts and
premiums. Outstanding balances also include PCI loans net of
any remaining purchase accounting adjustments. Information
about PCI loans is presented separately in the “Purchased
Credit-Impaired Loans” section of this Note.
December 31,
(in millions)
2011
2010
2009
2008
2007
Commercial:
Commercial and industrial
$
167,216
151,284
158,352
202,469
90,468
Real estate mortgage
105,975
99,435
97,527
94,923
36,747
Real estate construction
19,382
25,333
36,978
42,861
18,854
Lease financing
13,117
13,094
14,210
15,829
6,772
Foreign (1)
39,760
32,912
29,398
33,882
7,441
Total commercial
345,450
322,058
336,465
389,964
160,282
Consumer:
Real estate 1-4 family first mortgage
228,894
230,235
229,536
247,894
71,415
Real estate 1-4 family junior lien mortgage
85,991
96,149
103,708
110,164
75,565
Credit card
22,836
22,260
24,003
23,555
18,762
Other revolving credit and installment
86,460
86,565
89,058
93,253
56,171
Total consumer
424,181
435,209
446,305
474,866
221,913
Total loans
$
769,631
757,267
782,770
864,830
382,195
(1) Substantially all of our foreign loan portfolio is commercial loans. Loans are classified as foreign if the borrower’s primary address is outside of the United States.
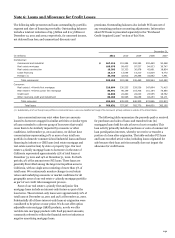
Loan concentrations may exist when there are amounts
loaned to borrowers engaged in similar activities or similar types
of loans extended to a diverse group of borrowers that would
cause them to be similarly impacted by economic or other
conditions. At December 31, 2011 and 2010, we did not have
concentrations representing 10% or more of our total loan
portfolio in domestic commercial and industrial loans and lease
financing by industry or CRE loans (real estate mortgage and
real estate construction) by state or property type. Our real
estate 1-4 family mortgage loans to borrowers in the state of
California represented approximately 13% of total loans at
December 31, 2011 and 14% at December 31, 2010. For both
periods, 3% of the amount were PCI loans. These loans are
generally diversified among the larger metropolitan areas in
California, with no single area consisting of more than 3% of
total loans. We continuously monitor changes in real estate
values and underlying economic or market conditions for all
geographic areas of our real estate 1-4 family mortgage portfolio
as part of our credit risk management process.
Some of our real estate 1-4 family first and junior lien
mortgage loans include an interest-only feature as part of the
loan terms. These interest-only loans were approximately 21% of
total loans at December 31, 2011 and 25% at December 31, 2010.
Substantially all of these interest-only loans at origination were
considered to be prime or near prime. We do not offer option
adjustable-rate mortgage (ARM) products, nor do we offer
variable-rate mortgage products with fixed payment amounts,
commonly referred to within the financial services industry as
negative amortizing mortgage loans.
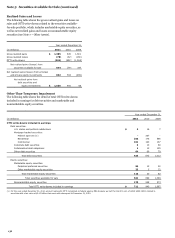
The following table summarizes the proceeds paid or received
for purchases and sales of loans and transfers from (to)
mortgages/loans held for sale at lower of cost or market. This
loan activity primarily includes purchases or sales of commercial
loan participation interests, whereby we receive or transfer a
portion of a loan after origination. The table excludes PCI loans
and loans recorded at fair value, including loans originated for
sale because their loan activity normally does not impact the
allowance for credit losses.
141