Wells Fargo 2011 Annual Report Download - page 147
Download and view the complete annual report
Please find page 147 of the 2011 Wells Fargo annual report below. You can navigate through the pages in the report by either clicking on the pages listed below, or by using the keyword search tool below to find specific information within the annual report.-
 1
1 -
2
-
3
-
4
-
5
-
6
-
7
-
8
-
9
-
10
-
11
-
12
-
13
-
14
-
15
-
16
-
17
-
18
-
19
-
20
-
21
-
22
-
23
-
24
-
25
-
26
-
27
-
28
-
29
-
30
-
31
-
32
-
33
-
34
-
35
-
36
-
37
-
38
-
39
-
40
-
41
-
42
-
43
-
44
-
45
-
46
-
47
-
48
-
49
-
50
-
51
-
52
-
53
-
54
-
55
-
56
-
57
-
58
-
59
-
60
-
61
-
62
-
63
-
64
-
65
-
66
-
67
-
68
-
69
-
70
-
71
-
72
-
73
-
74
-
75
-
76
-
77
-
78
-
79
-
80
-
81
-
82
-
83
-
84
-
85
-
86
-
87
-
88
-
89
-
90
-
91
-
92
-
93
-
94
-
95
-
96
-
97
-
98
-
99
-
100
-
101
-
102
-
103
-
104
-
105
-
106
-
107
-
108
-
109
-
110
-
111
-
112
-
113
-
114
-
115
-
116
-
117
-
118
-
119
-
120
-
121
-
122
-
123
-
124
-
125
-
126
-
127
-
128
-
129
-
130
-
131
-
132
-
133
-
134
-
135
-
136
-
 137
137 -
 138
138 -
 139
139 -
 140
140 -
 141
141 -
 142
142 -
 143
143 -
 144
144 -
 145
145 -
 146
146 -
 147
147 -
 148
148 -
 149
149 -
 150
150 -
 151
151 -
 152
152 -
 153
153 -
 154
154 -
 155
155 -
 156
156 -
 157
157 -
158
-
159
-
160
-
161
-
162
-
163
-
164
-
165
-
166
-
167
-
168
-
169
-
170
-
171
-
172
-
173
-
174
-
175
-
176
-
177
-
178
-
179
-
180
-
181
-
182
-
183
-
184
-
185
-
186
-
187
-
188
-
189
-
190
-
191
-
192
-
193
-
194
-
195
-
196
-
197
-
198
-
199
-
200
-
201
-
202
-
203
-
204
-
205
-
206
-
207
-
208
-
209
-
210
-
211
-
212
-
213
-
214
-
215
-
216
-
217
-
218
-
219
-
220
-
221
-
222
-
223
-
224
-
225
-
226
-
227
-
228
-
229
-
230
-
231
-
232
-
233
-
234
-
235
-
236
-
237
-
238
-
239
-
240
 |
 |

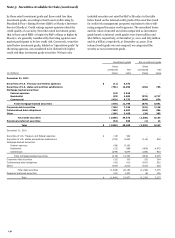
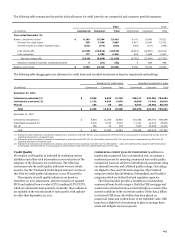
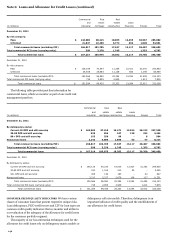
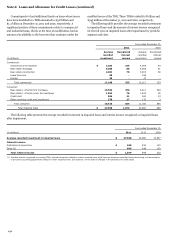
The following table summarizes the activity in the allowance for credit losses by our commercial and consumer portfolio segments.
2011
2010
(in millions)
Commercial
Consumer
Total
Commercial
Consumer
Total
Year ended December 31,
Balance, beginning of year
$
8,169
15,294
23,463
8,141
16,890
25,031
Provision for credit losses
365
7,534
7,899
4,913
10,840
15,753
Interest income on certain impaired loans
(161)
(171)
(332)
(139)
(127)
(266)
Loan charge-offs
(2,796)
(10,819)
(13,615)
(5,433)
(14,667)
(20,100)
Loan recoveries
777
1,539
2,316
678
1,669
2,347
Net loan charge-offs
(2,019)
(9,280)
(11,299)
(4,755)
(12,998)
(17,753)
Allowance related to business combinations/other
4
(67)
(63)
9
689
698
Balance, end of year
$
6,358
13,310
19,668
8,169
15,294
23,463
The following table disaggregates our allowance for credit losses and recorded investment in loans by impairment methodology.
Allowance for credit losses
Recorded investment in loans
(in millions)
Commercial
Consumer
Total
Commercial
Consumer
Total
December 31, 2011
Collectively evaluated (1)
$
4,060
8,699
12,759
328,117
376,785
704,902
Individually evaluated (2)
2,133
4,545
6,678
10,566
17,444
28,010
PCI (3)
165
66
231
6,767
29,952
36,719
Total
$
6,358
13,310
19,668
345,450
424,181
769,631
December 31, 2010
Collectively evaluated (1)
$
5,424
11,539
16,963
302,392
387,707
690,099
Individually evaluated (2)
2,479
3,723
6,202
11,731
14,007
25,738
PCI (3)
266
32
298
7,935
33,495
41,430
Total
$
8,169
15,294
23,463
322,058
435,209
757,267
(1) Represents loans collectively evaluated for impairment in accordance with ASC 450-20, Loss Contingencies (formerly FAS 5), and pursuant to amendments by ASU 2010-20
regarding allowance for unimpaired loans.
(2) Represents loans individually evaluated for impairment in accordance with ASC 310-10, Receivables (formerly FAS 114), and pursuant to amendments by ASU 2010-20
regarding allowance for impaired loans.
(3) Represents the allowance and related loan carrying value determined in accordance with ASC 310-30, Receivables – Loans and Debt Securities Acquired with Deteriorated
Credit Quality (formerly SOP 03-3) and pursuant to amendments by ASU 2010-20 regarding allowance for PCI loans.
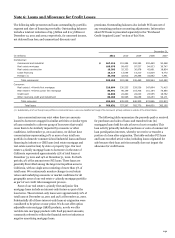
Credit Quality
We monitor credit quality as indicated by evaluating various
attributes and utilize such information in our evaluation of the
adequacy of the allowance for credit losses. The following
sections provide the credit quality indicators we most closely
monitor. See the “Purchased Credit-Impaired Loans” section of
this Note for credit quality information on our PCI portfolio.
The majority of credit quality indicators are based on
December 31, 2011 information, with the exception of updated
FICO and updated loan-to-value (LTV)/combined LTV (CLTV),
which are obtained at least quarterly. Generally, these indicators
are updated in the second month of each quarter, with updates
no older than September 30, 2011.
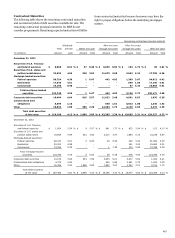
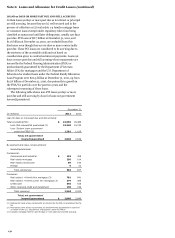
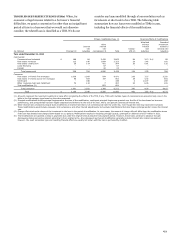
COMMERCIAL CREDIT QUALITY INDICATORS
In addition to
monitoring commercial loan concentration risk, we manage a
consistent process for assessing commercial loan credit quality.
Commercial loans are subject to individual risk assessment using
our internal borrower and collateral quality ratings. Our ratings
are aligned to Pass and Criticized categories. The Criticized
category includes Special Mention, Substandard, and Doubtful
categories which are defined by bank regulatory agencies.
The following table provides a breakdown of outstanding
commercial loans by risk category. Both the CRE mortgage and
construction criticized totals are relatively high as a result of the
current conditions in the real estate market. Of the $29.3 billion
in criticized CRE loans, $6.0 billion has been placed on
nonaccrual status and written down to net realizable value. CRE
loans have a high level of monitoring in place to manage these
assets and mitigate any loss exposure.
145