Wells Fargo 2011 Annual Report Download - page 56
Download and view the complete annual report
Please find page 56 of the 2011 Wells Fargo annual report below. You can navigate through the pages in the report by either clicking on the pages listed below, or by using the keyword search tool below to find specific information within the annual report.-
 1
1 -
2
-
3
-
4
-
5
-
6
-
7
-
8
-
9
-
10
-
11
-
12
-
13
-
14
-
15
-
16
-
17
-
18
-
19
-
20
-
21
-
22
-
23
-
24
-
25
-
26
-
27
-
28
-
29
-
30
-
31
-
32
-
33
-
34
-
35
-
36
-
37
-
38
-
39
-
40
-
41
-
42
-
43
-
44
-
45
-
 46
46 -
 47
47 -
 48
48 -
 49
49 -
 50
50 -
 51
51 -
 52
52 -
 53
53 -
 54
54 -
 55
55 -
 56
56 -
 57
57 -
 58
58 -
 59
59 -
 60
60 -
 61
61 -
 62
62 -
 63
63 -
 64
64 -
 65
65 -
 66
66 -
67
-
68
-
69
-
70
-
71
-
72
-
73
-
74
-
75
-
76
-
77
-
78
-
79
-
80
-
81
-
82
-
83
-
84
-
85
-
86
-
87
-
88
-
89
-
90
-
91
-
92
-
93
-
94
-
95
-
96
-
97
-
98
-
99
-
100
-
101
-
102
-
103
-
104
-
105
-
106
-
107
-
108
-
109
-
110
-
111
-
112
-
113
-
114
-
115
-
116
-
117
-
118
-
119
-
120
-
121
-
122
-
123
-
124
-
125
-
126
-
127
-
128
-
129
-
130
-
131
-
132
-
133
-
134
-
135
-
136
-
137
-
138
-
139
-
140
-
141
-
142
-
143
-
144
-
145
-
146
-
147
-
148
-
149
-
150
-
151
-
152
-
153
-
154
-
155
-
156
-
157
-
158
-
159
-
160
-
161
-
162
-
163
-
164
-
165
-
166
-
167
-
168
-
169
-
170
-
171
-
172
-
173
-
174
-
175
-
176
-
177
-
178
-
179
-
180
-
181
-
182
-
183
-
184
-
185
-
186
-
187
-
188
-
189
-
190
-
191
-
192
-
193
-
194
-
195
-
196
-
197
-
198
-
199
-
200
-
201
-
202
-
203
-
204
-
205
-
206
-
207
-
208
-
209
-
210
-
211
-
212
-
213
-
214
-
215
-
216
-
217
-
218
-
219
-
220
-
221
-
222
-
223
-
224
-
225
-
226
-
227
-
228
-
229
-
230
-
231
-
232
-
233
-
234
-
235
-
236
-
237
-
238
-
239
-
240
 |
 |

Risk Management — Credit Risk Management (continued)
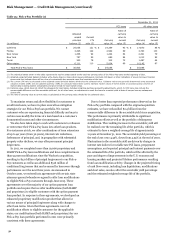
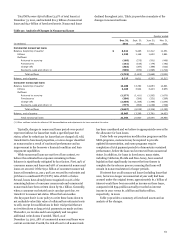
were PCI loans from Wachovia) at December 31, 2011, mostly
within the larger metropolitan areas, with no single California
metropolitan area consisting of more than 3% of total loans. We
continuously monitor changes in real estate values and
underlying economic or market conditions for all geographic
areas of our real estate 1-4 family mortgage portfolio as part of
our credit risk management process.
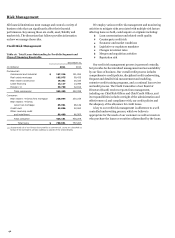
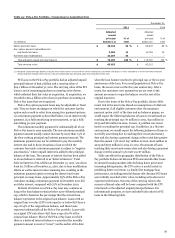
Part of our credit monitoring includes tracking delinquency,
FICO scores and collateral values (LTV/CLTV) on the entire real
estate 1-4 family mortgage loan portfolio. These metrics
experienced improvement throughout 2011, on the non-PCI
mortgage portfolio, with the majority of the improvement
occurring in the first half of 2011. Loans 30 days or more
delinquent at December 31, 2011, totaled $18.4 billion, or 6%, of
total non-PCI mortgages, compared with $20.3 billion, or 7%, at
December 31, 2010. Loans with FICO scores lower than 640
totaled $44.1 billion at December 31, 2011, or 15% of all non-PCI
mortgages, compared with $50.7 billion, or 17%, at
December 31, 2010. Mortgages with a LTV/CLTV greater than
100% totaled $74.2 billion at December 31, 2011, or 26% of total
non-PCI mortgages, compared with $84.9 billion, or 29%, at
December 31, 2010. Information regarding credit risk trends can
be found in Note 6 (Loans and Allowance for Credit Losses) to
Financial Statements in this Report.
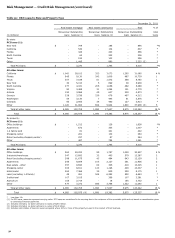
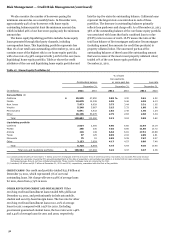
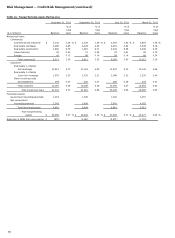
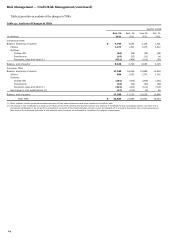
Table 23: Real Estate 1-4 Family Mortgage Loans by State
December 31, 2011
Real estate
Real estate
Total real
1-4 family
1-4 family
estate 1-4
% of
first
junior lien
family
total
(in millions)
mortgage
mortgage
mortgage
loans
PCI loans:
California
$
19,336
42
19,378
3
%
Florida
2,700
38
2,738
*
New Jersey
1,285
25
1,310
*
Other (1)
6,425
101
6,526
*
Total PCI loans
$
29,746
206
29,952
4
%
All other loans:
California
$
54,312
23,934
78,246
10
%
Florida
16,001
7,664
23,665
3
New Jersey
9,007
6,240
15,247
2
New York
9,045
3,597
12,642
2
Virginia
5,874
4,431
10,305
1
Pennsylvania
5,978
3,929
9,907
1
North Carolina
5,642
3,582
9,224
1
Georgia
4,583
3,369
7,952
1
Texas
6,444
1,335
7,779
1
Other (2)
55,707
27,704
83,411
12
Government insured/
guaranteed loans (3)
26,555
-
26,555
3
Total all
other loans
$
199,148
85,785
284,933
37
%
Total
$
228,894
85,991
314,885
41
%
* Less than 1%.
(1) Consists of 45 states; no state had loans in excess of $729 million.
(2) Consists of 41 states; no state had loans in excess of $6.6 billion.
(3) Represents loans whose repayments are insured by the FHA or guaranteed by
the VA. In 2011, we consolidated $5.6 billion of previously sold FHA insured real
estate 1-4 family reverse mortgages.
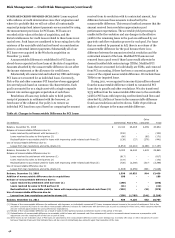
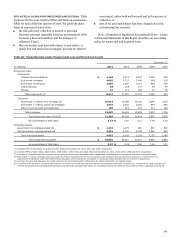
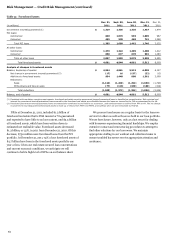
PICK-A-PAY PORTFOLIO
The Pick-a-Pay portfolio was one of the
consumer residential first mortgage portfolios we acquired from
Wachovia and a majority of the portfolio was identified as PCI
loans. The Pick-a-Pay portfolio is a liquidating portfolio, as
Wachovia ceased originating new Pick-a-Pay loans in 2008.
The Pick-a-Pay portfolio includes loans that offer payment
options (Pick-a-Pay option payment loans), and also includes
loans that were originated without the option payment feature,
loans that no longer offer the option feature as a result of our
modification efforts since the acquisition, and loans where the
customer voluntarily converted to a fixed-rate product. The Pick-
a-Pay portfolio is included in the consumer real estate 1-4 family
first mortgage class of loans throughout this Report. Real estate
1-4 family junior lien mortgages and lines of credit associated
with Pick-a-Pay loans are reported in the home equity portfolio.
Table 24 provides balances over time related to the types of
loans included in the portfolio since acquisition.
54