Wells Fargo 2011 Annual Report Download - page 122
Download and view the complete annual report
Please find page 122 of the 2011 Wells Fargo annual report below. You can navigate through the pages in the report by either clicking on the pages listed below, or by using the keyword search tool below to find specific information within the annual report.-
 1
1 -
2
-
3
-
4
-
5
-
6
-
7
-
8
-
9
-
10
-
11
-
12
-
13
-
14
-
15
-
16
-
17
-
18
-
19
-
20
-
21
-
22
-
23
-
24
-
25
-
26
-
27
-
28
-
29
-
30
-
31
-
32
-
33
-
34
-
35
-
36
-
37
-
38
-
39
-
40
-
41
-
42
-
43
-
44
-
45
-
46
-
47
-
48
-
49
-
50
-
51
-
52
-
53
-
54
-
55
-
56
-
57
-
58
-
59
-
60
-
61
-
62
-
63
-
64
-
65
-
66
-
67
-
68
-
69
-
70
-
71
-
72
-
73
-
74
-
75
-
76
-
77
-
78
-
79
-
80
-
81
-
82
-
83
-
84
-
85
-
86
-
87
-
88
-
89
-
90
-
91
-
92
-
93
-
94
-
95
-
96
-
97
-
98
-
99
-
100
-
101
-
102
-
103
-
104
-
105
-
106
-
107
-
108
-
109
-
110
-
111
-
 112
112 -
 113
113 -
 114
114 -
 115
115 -
 116
116 -
 117
117 -
 118
118 -
 119
119 -
 120
120 -
 121
121 -
 122
122 -
 123
123 -
 124
124 -
 125
125 -
 126
126 -
 127
127 -
 128
128 -
 129
129 -
 130
130 -
 131
131 -
 132
132 -
133
-
134
-
135
-
136
-
137
-
138
-
139
-
140
-
141
-
142
-
143
-
144
-
145
-
146
-
147
-
148
-
149
-
150
-
151
-
152
-
153
-
154
-
155
-
156
-
157
-
158
-
159
-
160
-
161
-
162
-
163
-
164
-
165
-
166
-
167
-
168
-
169
-
170
-
171
-
172
-
173
-
174
-
175
-
176
-
177
-
178
-
179
-
180
-
181
-
182
-
183
-
184
-
185
-
186
-
187
-
188
-
189
-
190
-
191
-
192
-
193
-
194
-
195
-
196
-
197
-
198
-
199
-
200
-
201
-
202
-
203
-
204
-
205
-
206
-
207
-
208
-
209
-
210
-
211
-
212
-
213
-
214
-
215
-
216
-
217
-
218
-
219
-
220
-
221
-
222
-
223
-
224
-
225
-
226
-
227
-
228
-
229
-
230
-
231
-
232
-
233
-
234
-
235
-
236
-
237
-
238
-
239
-
240
 |
 |

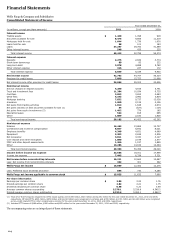
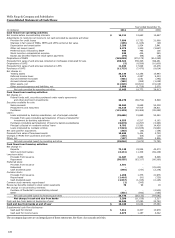
Wells Fargo & Company and Subsidiaries
Consolidated Statement of Cash Flows
Year ended December 31,
(in millions)
2011
2010
2009
Cash flows from operating activities:
Net income before noncontrolling interests
$
16,211
12,663
12,667
Adjustments to reconcile net income to net cash provided by operating activities:
Provision for credit losses
7,899
15,753
21,668
Changes in fair value of MSRs, MHFS and LHFS carried at fair value
(295)
(1,025)
(20)
Depreciation and amortization
2,208
1,924
2,841
Other net losses (gains)
3,273
1,345
(3,867)
Preferred stock released by ESOP
959
796
106
Stock incentive compensation expense
529
436
245
Excess tax benefits related to stock option payments
(79)
(98)
(18)
Originations of MHFS
(345,099)
(370,175)
(414,299)
Proceeds from sales of and principal collected on mortgages originated for sale
298,524
355,325
399,261
Originations of LHFS
(5)
(4,596)
(10,800)
Proceeds from sales of and principal collected on LHFS
11,833
17,828
20,276
Purchases of LHFS
(11,723)
(7,470)
(8,614)
Net change in:
Trading assets
35,149
12,356
13,983
Deferred income taxes
3,573
4,287
9,453
Accrued interest receivable
(401)
1,051
(293)
Accrued interest payable
(362)
(268)
(1,028)
Other assets, net
(11,529)
(19,631)
(15,018)
Other accrued expenses and liabilities, net
3,000
(1,729)
2,070
Net cash provided by operating activities
13,665
18,772
28,613
Cash flows from investing activities:
Net change in:
Federal funds sold, securities purchased under resale agreements
and other short-term investments
36,270
(39,752)
8,548
Securities available for sale:
Sales proceeds
23,062
8,668
53,038
Prepayments and maturities
52,618
47,919
38,811
Purchases
(121,235)
(53,466)
(95,285)
Loans:
Loans originated by banking subsidiaries, net of principal collected
(35,686)
15,869
52,240
Proceeds from sales (including participations) of loans originated for
investment by banking subsidiaries
6,555
6,517
6,162
Purchases (including participations) of loans by banking subsidiaries
(8,878)
(2,297)
(3,363)
Principal collected on nonbank entities’ loans
9,782
15,560
14,428
Loans originated by nonbank entities
(7,522)
(10,836)
(9,961)
Net cash paid for acquisitions
(353)
(36)
(138)
Proceeds from sales of foreclosed assets
10,655
5,444
3,759
Changes in MSRs from purchases and sales
(155)
(65)
(10)
Other, net
(157)
2,800
3,556
Net cash provided (used) by investing activities
(35,044)
(3,675)
71,785
Cash flows from financing activities:
Net change in:
Deposits
72,128
23,924
42,473
Short-term borrowings
(6,231)
11,308
(69,108)
Long-term debt:
Proceeds from issuance
11,687
3,489
8,396
Repayment
(50,555)
(63,317)
(66,260)
Preferred stock:
Proceeds from issuance
2,501
-
-
Redeemed
-
-
(25,000)
Cash dividends paid
(844)
(737)
(2,178)
Common stock:
Proceeds from issuance
1,296
1,375
21,976
Repurchased
(2,416)
(91)
(220)
Cash dividends paid
(2,537)
(1,045)
(2,125)
Common stock warrants repurchased
(2)
(545)
-
Excess tax benefits related to stock option payments
79
98
18
Net change in noncontrolling interests:
Purchase of Prudential's noncontrolling interest
-
-
(4,500)
Other
(331)
(592)
(553)
Net cash provided (used) by financing activities
24,775
(26,133)
(97,081)
Net change in cash and due from banks
3,396
(11,036)
3,317
Cash and due from banks at beginning of year
16,044
27,080
23,763
Cash and due from banks at end of year
$
19,440
16,044
27,080
Supplemental cash flow disclosures:
Cash paid for interest
$
7,011
8,307
10,978
Cash paid for income taxes
4,875
1,187
3,042
The accompanying notes are an integral part of these statements. See Note 1 for noncash activities.
120