Wells Fargo 2011 Annual Report Download - page 43
Download and view the complete annual report
Please find page 43 of the 2011 Wells Fargo annual report below. You can navigate through the pages in the report by either clicking on the pages listed below, or by using the keyword search tool below to find specific information within the annual report.-
 1
1 -
2
-
3
-
4
-
5
-
6
-
7
-
8
-
9
-
10
-
11
-
12
-
13
-
14
-
15
-
16
-
17
-
18
-
19
-
20
-
21
-
22
-
23
-
24
-
25
-
26
-
27
-
28
-
29
-
30
-
31
-
32
-
 33
33 -
 34
34 -
 35
35 -
 36
36 -
 37
37 -
 38
38 -
 39
39 -
 40
40 -
 41
41 -
 42
42 -
 43
43 -
 44
44 -
 45
45 -
 46
46 -
 47
47 -
 48
48 -
 49
49 -
 50
50 -
 51
51 -
 52
52 -
 53
53 -
54
-
55
-
56
-
57
-
58
-
59
-
60
-
61
-
62
-
63
-
64
-
65
-
66
-
67
-
68
-
69
-
70
-
71
-
72
-
73
-
74
-
75
-
76
-
77
-
78
-
79
-
80
-
81
-
82
-
83
-
84
-
85
-
86
-
87
-
88
-
89
-
90
-
91
-
92
-
93
-
94
-
95
-
96
-
97
-
98
-
99
-
100
-
101
-
102
-
103
-
104
-
105
-
106
-
107
-
108
-
109
-
110
-
111
-
112
-
113
-
114
-
115
-
116
-
117
-
118
-
119
-
120
-
121
-
122
-
123
-
124
-
125
-
126
-
127
-
128
-
129
-
130
-
131
-
132
-
133
-
134
-
135
-
136
-
137
-
138
-
139
-
140
-
141
-
142
-
143
-
144
-
145
-
146
-
147
-
148
-
149
-
150
-
151
-
152
-
153
-
154
-
155
-
156
-
157
-
158
-
159
-
160
-
161
-
162
-
163
-
164
-
165
-
166
-
167
-
168
-
169
-
170
-
171
-
172
-
173
-
174
-
175
-
176
-
177
-
178
-
179
-
180
-
181
-
182
-
183
-
184
-
185
-
186
-
187
-
188
-
189
-
190
-
191
-
192
-
193
-
194
-
195
-
196
-
197
-
198
-
199
-
200
-
201
-
202
-
203
-
204
-
205
-
206
-
207
-
208
-
209
-
210
-
211
-
212
-
213
-
214
-
215
-
216
-
217
-
218
-
219
-
220
-
221
-
222
-
223
-
224
-
225
-
226
-
227
-
228
-
229
-
230
-
231
-
232
-
233
-
234
-
235
-
236
-
237
-
238
-
239
-
240
 |
 |

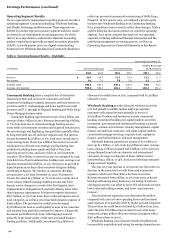
all customers segments, with most lending areas experiencing
double-digit rates of growth in loans outstandings, including in
Asset Backed Finance, Capital Finance, Commercial Banking,
Commercial Real Estate, Government and Institutional Banking,
International, and Real Estate Capital Markets.
Wealth, Brokerage and Retirement provides a full range of
financial advisory services to clients using a planning approach
to meet each client's needs. Wealth Management provides
affluent and high net worth clients with a complete range of
wealth management solutions, including financial planning,
private banking, credit, investment management and trust.
Family Wealth (which will be rebranded as Abbot Downing, a
Wells Fargo Business, in April 2012) meets the unique needs of
ultra high net worth customers. Brokerage serves customers'
advisory, brokerage and financial needs as part of one of the
largest full-service brokerage firms in the United States.
Retirement is a national leader in providing institutional
retirement and trust services (including 401(k) and pension plan
record keeping) for businesses, retail retirement solutions for
individuals, and reinsurance services for the life insurance
industry.
Wealth, Brokerage and Retirement reported net income of
$1.3 billion in 2011, up $283 million, or 28%, from 2010.
Revenue increased $458 million, or 4%, from 2010, as net
interest income increased $148 million, or 5%, and noninterest
income increased $310 million, or 3%, from 2010. Net interest
income increased due to higher investment income and the
impact of deposit balance growth. Average core deposits of
$130.4 billion in 2011 increased 8% from 2010. Noninterest
income increased as higher asset-based fees and a gain on the
sale of the H.D. Vest Financial Services business exceeded losses
on deferred compensation plan investments (offset in expense)
and lower brokerage transaction revenue. Noninterest expense
increased $167 million, or 2%, from 2010, primarily due to
growth in personnel cost largely due to higher broker
commissions driven by increased production levels, as well as
increases in other incentive compensation, offset by lower
deferred compensation. The provision for credit losses
decreased $164 million, or 49%, from 2010, due to lower net
charge-offs.
Balance Sheet Analysis
During 2011, our total assets grew 4%, funded by core deposit
growth of 9% and internal capital generation, partially offset by a
reduction in our long-term borrowings. Our total loans and core
deposits at December 31, 2011, were up from the previous year.
At December 31, 2011, core deposits totaled 113% of the loan
portfolio, and we have the capacity to add higher yielding
earning assets to generate future revenue and earnings growth.
The strength of our business model produced record earnings
and high rates of internal capital generation as reflected in our
improved capital ratios. Tier 1 capital increased to 11.33% as a
percentage of total risk-weighted assets, and Tier 1 common
equity to 9.46% at December 31, 2011, up from 11.16% and
8.30%, respectively, at December 31, 2010. Total capital was
14.76% and Tier 1 leverage was 9.03%, compared with 15.01%
and 9.19%, respectively, at December 2010. For additional
information about our capital requirements, see Note 26
(Regulatory and Agency Capital Requirements) to Financial
Statements in this Report.
The following discussion provides additional information
about the major components of our balance sheet. Information
about changes in our asset mix and about our capital is included
in the “Earnings Performance – Net Interest Income” and
“Capital Management” sections of this Report.
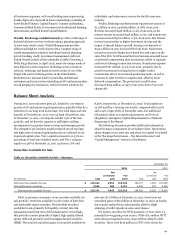
Securities Available for Sale
Table 10: Securities Available for Sale – Summary
December 31,
2011
2010
Net
Net
unrealized
Fair
unrealized
Fair
(in millions)
Cost
gain
value
Cost
gain
value
Debt securities available for sale
$
212,642
6,554
219,196
160,071
7,394
167,465
Marketable equity securities
2,929
488
3,417
4,258
931
5,189
Total securities available for sale
$
215,571
7,042
222,613
164,329
8,325
172,654
Table 10 presents a summary of our securities available-for-
sale portfolio. Securities available for sale consist of both debt
and marketable equity securities. We hold debt securities
available for sale primarily for liquidity, interest rate risk
management and long-term yield enhancement. Accordingly,
this portfolio consists primarily of liquid, high-quality federal
agency debt and privately issued mortgage-backed securities
(MBS). The total net unrealized gains on securities available for
sale were $7.0 billion at December 31, 2011, down from net
unrealized gains of $8.3 billion at December 31, 2010, primarily
due to gains realized from sales partially offset by slight
widening of credit spreads in some asset classes.
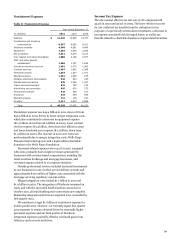
We analyze securities for OTTI quarterly, or more often if a
potential loss-triggering event occurs. Of the $711 million OTTI
write-downs recognized in 2011, $423 million related to debt
securities. There were $118 million in OTTI write-downs for
41