Wells Fargo 2011 Annual Report Download - page 66
Download and view the complete annual report
Please find page 66 of the 2011 Wells Fargo annual report below. You can navigate through the pages in the report by either clicking on the pages listed below, or by using the keyword search tool below to find specific information within the annual report.-
 1
1 -
2
-
3
-
4
-
5
-
6
-
7
-
8
-
9
-
10
-
11
-
12
-
13
-
14
-
15
-
16
-
17
-
18
-
19
-
20
-
21
-
22
-
23
-
24
-
25
-
26
-
27
-
28
-
29
-
30
-
31
-
32
-
33
-
34
-
35
-
36
-
37
-
38
-
39
-
40
-
41
-
42
-
43
-
44
-
45
-
46
-
47
-
48
-
49
-
50
-
51
-
52
-
53
-
54
-
55
-
 56
56 -
 57
57 -
 58
58 -
 59
59 -
 60
60 -
 61
61 -
 62
62 -
 63
63 -
 64
64 -
 65
65 -
 66
66 -
 67
67 -
 68
68 -
 69
69 -
 70
70 -
 71
71 -
 72
72 -
 73
73 -
 74
74 -
 75
75 -
 76
76 -
77
-
78
-
79
-
80
-
81
-
82
-
83
-
84
-
85
-
86
-
87
-
88
-
89
-
90
-
91
-
92
-
93
-
94
-
95
-
96
-
97
-
98
-
99
-
100
-
101
-
102
-
103
-
104
-
105
-
106
-
107
-
108
-
109
-
110
-
111
-
112
-
113
-
114
-
115
-
116
-
117
-
118
-
119
-
120
-
121
-
122
-
123
-
124
-
125
-
126
-
127
-
128
-
129
-
130
-
131
-
132
-
133
-
134
-
135
-
136
-
137
-
138
-
139
-
140
-
141
-
142
-
143
-
144
-
145
-
146
-
147
-
148
-
149
-
150
-
151
-
152
-
153
-
154
-
155
-
156
-
157
-
158
-
159
-
160
-
161
-
162
-
163
-
164
-
165
-
166
-
167
-
168
-
169
-
170
-
171
-
172
-
173
-
174
-
175
-
176
-
177
-
178
-
179
-
180
-
181
-
182
-
183
-
184
-
185
-
186
-
187
-
188
-
189
-
190
-
191
-
192
-
193
-
194
-
195
-
196
-
197
-
198
-
199
-
200
-
201
-
202
-
203
-
204
-
205
-
206
-
207
-
208
-
209
-
210
-
211
-
212
-
213
-
214
-
215
-
216
-
217
-
218
-
219
-
220
-
221
-
222
-
223
-
224
-
225
-
226
-
227
-
228
-
229
-
230
-
231
-
232
-
233
-
234
-
235
-
236
-
237
-
238
-
239
-
240
 |
 |

Risk Management — Credit Risk Management (continued)
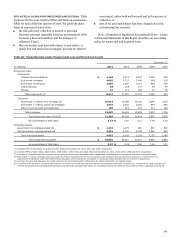
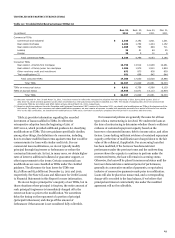
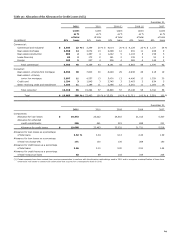
Table 33 provides an analysis of the changes in TDRs.
Table 33: Analysis of Changes in TDRs
Quarter ended
Dec. 31,
Sept. 30,
June 30,
Mar. 31,
(in millions)
2011
2011
2011
2011
Commercial TDRs
Balance, beginning of quarter
$
4,799
4,053
3,145
1,751
Inflows
1,271
1,321
1,275
1,512
Outflows
Charge-offs
(84)
(68)
(36)
(64)
Foreclosures
(16)
(23)
(21)
(4)
Payments, sales and other (1)
(621)
(484)
(310)
(50)
Balance, end of quarter
5,349
4,799
4,053
3,145
Consumer TDRs
Balance, beginning of quarter
17,030
16,628
15,888
14,929
Inflows
904
1,455
1,574
1,740
Outflows
Charge-offs
(261)
(290)
(289)
(251)
Foreclosures
(33)
(39)
(33)
(39)
Payments, sales and other (1)
(315)
(450)
(510)
(513)
Net change in trial modifications (2)
(17)
(274)
(2)
22
Balance, end of quarter
17,308
17,030
16,628
15,888
Total TDRs
$
22,657
21,829
20,681
19,033
(1)
Other outflows include normal amortization/accretion of loan basis adjustments and loans transferred to held-for-sale.
(2)
Net change in trial modifications is made up of inflows of new TDRs entering trial payment period, and outflows of modifications that successfully perform and enter into a
permanent modification or do not perform according to the terms of the trial period plan, and as a result are charged
-
off or moved to foreclosure. Our recent experience is
that most of the mortgages that enter a trial payment period program are successful in completing the program requirements.
64