Wells Fargo 2011 Annual Report Download
Download and view the complete annual report
Please find the complete 2011 Wells Fargo annual report below. You can navigate through the pages in the report by either clicking on the pages listed below, or by using the keyword search tool below to find specific information within the annual report.-
 1
1 -
 2
2 -
 3
3 -
 4
4 -
 5
5 -
 6
6 -
 7
7 -
 8
8 -
 9
9 -
 10
10 -
 11
11 -
 12
12 -
13
-
14
-
15
-
16
-
17
-
18
-
19
-
20
-
21
-
22
-
23
-
24
-
25
-
26
-
27
-
28
-
29
-
30
-
31
-
32
-
33
-
34
-
35
-
36
-
37
-
38
-
39
-
40
-
41
-
42
-
43
-
44
-
45
-
46
-
47
-
48
-
49
-
50
-
51
-
52
-
53
-
54
-
55
-
56
-
57
-
58
-
59
-
60
-
61
-
62
-
63
-
64
-
65
-
66
-
67
-
68
-
69
-
70
-
71
-
72
-
73
-
74
-
75
-
76
-
77
-
78
-
79
-
80
-
81
-
82
-
83
-
84
-
85
-
86
-
87
-
88
-
89
-
90
-
91
-
92
-
93
-
94
-
95
-
96
-
97
-
98
-
99
-
100
-
101
-
102
-
103
-
104
-
105
-
106
-
107
-
108
-
109
-
110
-
111
-
112
-
113
-
114
-
115
-
116
-
117
-
118
-
119
-
120
-
121
-
122
-
123
-
124
-
125
-
126
-
127
-
128
-
129
-
130
-
131
-
132
-
133
-
134
-
135
-
136
-
137
-
138
-
139
-
140
-
141
-
142
-
143
-
144
-
145
-
146
-
147
-
148
-
149
-
150
-
151
-
152
-
153
-
154
-
155
-
156
-
157
-
158
-
159
-
160
-
161
-
162
-
163
-
164
-
165
-
166
-
167
-
168
-
169
-
170
-
171
-
172
-
173
-
174
-
175
-
176
-
177
-
178
-
179
-
180
-
181
-
182
-
183
-
184
-
185
-
186
-
187
-
188
-
189
-
190
-
191
-
192
-
193
-
194
-
195
-
196
-
197
-
198
-
199
-
200
-
201
-
202
-
203
-
204
-
205
-
206
-
207
-
208
-
209
-
210
-
211
-
212
-
213
-
214
-
215
-
216
-
217
-
218
-
219
-
220
-
221
-
222
-
223
-
224
-
225
-
226
-
227
-
228
-
229
-
230
-
231
-
232
-
233
-
234
-
235
-
236
-
237
-
238
-
239
-
240
 |
 |

New opportunities. Unchanging vision.
“The reason we wake up in the morning is to help our
customers succeed financially and to satisfy all their
financial needs. The result is we make money because
of our focus on serving customers, not the other way
around. This time-tested vision will forever be what
matters to WellsFargo. We’llnever put the stagecoach
ahead of thehorses.”— John G. Stumpf, Chairman, President and Chief Executive Ocer
WELLS FARGO WELLS FARGO & COMPANY ANNUAL REPORTNEW OPPORTUNITIES.UNCHANGING VISION.
Wells Fargo & Company Annual Report 2011
Table of contents
-
Page 1
Wmlls Fargo & Company Annual Rmport 2011 WELLS FARGO NEW OppORtuNitiES. uNChANGiNG ViSiON. W E T T S FA R G O & CO M PA N Y 2 01 1 A N N UA T R E P O R T New opportunities. Unchanging vision. "The reason we wake up in the morning is to help our customers succeed financially and to satisfy all ... -
Page 2
... services company - community-based and relationship-oriented - serving people across the nation and around the world. Our corporate headquarters is in San Francisco, but all our stores, regional commercial banking centers, ATMs, Wells Fargo Phone Bank,SM and internet sites are headquarters... -
Page 3
Tony Williamson of Ajasa Technologies, New Hope, Minn. 1 -
Page 4
...Your hometown Wells Fargo bank is wherever you happen to be. Guided by our time-tested Vision & Values, we also have more opportunities than ever before to serve our customers and communities, and help our country grow. We're fortunate to have the most extensive U.S. financial services store network... -
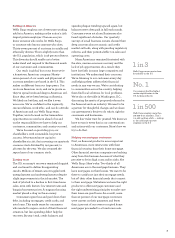
Page 5
...of our mortgage customers were current on their payments and fewer than 2 percent of our owner-occupied home mortgages proceeded to a foreclosure sale. 1 in 3 Wells Fargo serves one in three households in the U.S. No. 1 Our company had the highest market capitalization in the U.S. banking industry... -
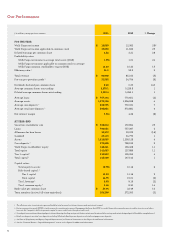
Page 6
... share amounts 2011 2010 % Change FOR THE YEAR Wells Fargo net income Wells Fargo net income applicable to common stock Diluted earnings per common share Profitability ratios: Wells Fargo net income to average total assets (ROA) Wells Fargo net income applicable to common stock to average Wells... -
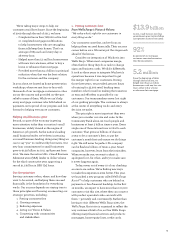
Page 7
... us, as One Wells Fargo offering many financial services and products: mortgages, home equity lines, credit cards, $13.9 billion In 2011, small business new loan commitments grew to $13.9 billion (an 8 percent increase from 2010). 92% 92 percent of our mortgage customers remained current on their... -
Page 8
... new customers through organic growth and disciplined acquisitions. We have a huge opportunity to earn more business from our current customers. Our average retail bank household cross-sell reached a record 5.92 products in 2011, up from 5.70 in the fourth quarter of 2010. In our Western markets... -
Page 9
... automobile finance businesses to better serve customers. We simplified our Wealth Management regional structure to operate seven instead of 12xregions. Our businesses reduced the number of temporary resources and contractors in high-cost locations by 29xpercent in 2011. Reducing expenses also helps... -
Page 10
...as a guide for their daily work. It's our gold standard for serving our customers, working together as team members, serving our communities, and honoring our shareholders for investing in our company. You can read our Vision & Values in the "About Us" section on wellsfargo.com. Check it out and let... -
Page 11
... affordable housing. The Wells Fargo Housing Foundation mobilized more than 9,800 volunteers who gave more than 70,000 hours to build or refurbish more than 550 homes in low- to moderate-income communities. Our company also supports our communities and the economy by paying taxes. The past 10 years... -
Page 12
Juston (left) and Stuart Alboum of W. Alboum Hat Co. Inc., Irvongton, N.J. 10 -
Page 13
... founded in 1921 - that means working with Business Banking's Jeff Lenches to refinance the mortgage on their factory. The financing helped W. Alboum Hat Co. Inc. add new machines and boost production while enhancing the trust they require in a business relationship. "I feel very confident going to... -
Page 14
1:1 12 mortgage relationships When you're behind on your mortgage payment, the last thing you need is uncertainty about who to call. That's one reason Wells Fargo created a special Home Preservation team providing a single point of contact. -
Page 15
... of 2009 through the end of 2011, Wells Fargo has provided more than $4.1 billion in mortgage principal reduction. 728,000+ Since the beginning of 2009 through the end of 2011, we've completed more than 728,000 mortgage modifications that have helped struggling homeowners keep their homes. 13 -
Page 16
...their safe deposit box, and Teller Chrispian Boyd asked, "Would you like me to recommend someone who can help you?" 9,054 Wells Fargo operates the largest store network in the U.S., including 6,239 banking, 1,375 Wells Fargo Advisors, 725 mortgage, and 715 wholesale locations. Wells Fargo Advisors... -
Page 17
Bubba and Cathy Danforth, Orangedale, Fla. 15 -
Page 18
Community Development's Brenda Wright (left) with Elvia Buendia of La Luna Cupcakes, San Francisco, Calif. 16 -
Page 19
... would have had a tough time finding working space, capital, and an understanding of how to navigate all the red tape involved in starting a new food business. Today 32 business owners are generating $2 million in annual revenue, creating nearly a hundred community jobs, and introducing thousands of... -
Page 20
... felping customers succeed financially means more than providing advice to millions of individuals as they earn, save, spend, and invest. It also means working with thousands of innovative companies with new ideas - like the one that now supplies 53.5 megawatts of solar energy in New Mexico... -
Page 21
...seven business groups across the company equipped to serve different aspects of the cleantech industry and environmental markets, from solar financing for homeowners and businesses to insurance brokerage and trust services for large-scale environmental projects. Wells Fargo began investing equity in... -
Page 22
Army Sgt. Buddy Mays and his family, Meansville, Ga. 20 -
Page 23
... Fargo Home Mortgage, his wheelchair or afford because of its Mays's house today is a different place: wheelchair accessible and high energy costs. easier to maintain, thanks to energyThat all changed because of efficient heating and cooling systems, Wells Fargo's partnership with Purple enhanced... -
Page 24
..., and operation 1.5 million hours volumteered by team members - average value of a volumteer hour: $21.36, equivalemt to $32.1 milliom im time comtributed Our pommunity pommitment Sopial papital applying our best thinking as leaders in making communities better places to live and work Team member... -
Page 25
... 3. Credit 4. Finance 5. Governance and Nominating 6. Human Resources 7. Risk * Lead Director Susan E. Engel 3, 4, 6 Chiep Executive Officer Portero, Inc. New York, New York (Online luxury retailer) Federico F. Peña 1 Senior Advisor Vestar Capital Partners Denver, Colorado (Private equity... -
Page 26
... Finance Lesley A. Eckstein, Community Lending and Investment Douglas J. Mazer, Commercial Mortgage Origination John M. McQueen, Wells Fargo Equipment Finance, Inc. Alan Wiener, Multi-family Housing Customer Connection Diana L. Starcher Internet Services sroup James P. Smith Regional Banking... -
Page 27
... Short-Term Investments Securities Available for Sale Loans and Allowance for Credit Losses Premises, Equipment, Lease Commitments and Other Assets Securitizations and Variable Interest Entities Mortgage Banking Activities Intangible Assets Deposits Short-Term Borrowings Long-Term Debt Guarantees... -
Page 28
...Wachovia Corporation (Wachovia). See the Glossary of Acronyms at the end of this Report for terms used throughout this Report. Financial Review Overview Wells Fargo & Company is a diversified financial services company with $1.3 trillion in assets. Founded in 1852 and headquartered in San Francisco... -
Page 29
...2011, predominantly reflecting decreased interest income on securities available for sale and loans due to lower yields as market rates declined. The decline in revenue was also affected by lower mortgage banking noninterest income as a result of lower originations and higher servicing-related costs... -
Page 30
...interests Wells Fargo net income Earnings per common share Diluted earnings per common share Dividends declared per common share Balance sheet (at year end) Securities available for sale Loans Allowance for loan losses Goodwill Assets Core deposits (1) Long-term debt Wells Fargo stockholders' equity... -
Page 31
...2: Ratios and Per Common Share Data Year ended December 31, 2011 Profitability ratios Wells Fargo net income to average assets (ROA) Wells Fargo net income applicable to common stock to average Wells Fargo common stockholders' equity (ROE) Efficiency ratio (1) Capital ratios At year end: Wells Fargo... -
Page 32
... with $40.5 billion (47%) in 2010 and $42.4 billion (48%) in 2009. The decrease in noninterest income in 2011 was due largely to lower service charges on deposit accounts, net gains on mortgage loan origination/sales activities and net gains from trading activities. Noninterest expense was $49... -
Page 33
... income (A) Noninterest income Service charges on deposit accounts Trust and investment fees (1) Card fees Other fees (1) Mortgage banking (1) Insurance Net gains from trading activities Net gains (losses) on debt securities available for sale Net gains from equity investments Operating leases... -
Page 34
... of the balance sheet as higher-yielding loan and security runoff was partially offset by new loans, investment portfolio purchases and growth in short-term investments. The decline in earning asset income was mitigated by a reduction in funding costs resulting from disciplined deposit pricing, debt... -
Page 35
...of Average Earning Assets Year ended December 31, 2011 Average balance % of earning assets Average balance 2010 % of earning assets (in millions) Earning assets Federal funds sold, securities purchased under resale agreements and other short-term investments Trading assets Debt securities available... -
Page 36
... 2011 Average balance Yields/ rates Interest income/ expense Average balance Yields/ rates 2010 Interest income/ expense (in millions) Earning assets Federal funds sold, securities purchased under resale agreements and other short-term investments Trading assets Securities available for sale... -
Page 37
...-equivalent adjustments of $696 million, $629 million, $706 million, $288 million and $146 million for 2011, 2010, 2009, 2008 and 2007, respectively, primarily related to tax-exempt income on certain loans and securities. The federal statutory tax rate utilized was 35% for the periods presented. 35 -
Page 38
... of Changes in Net Interest Income Year ended December 31, 2011 over 2010 (in millions) Increase (decrease) in interest income: Federal funds sold, securities purchased under resale agreements and other short-term investments Trading assets Debt securities available for sale (1): Securities of... -
Page 39
... limits. We currently expect future volume, product or account changes may over time mitigate at least half of the earnings reduction resulting from the FRB's debit card interchange rules. Mortgage banking noninterest income, consisting of net servicing income and net gains on loan origination/sales... -
Page 40
... credit spreads, reduced prices on financial assets and limited new issue origination and trading opportunities. The decline also reflects a loss of $377 million in 2011 relating to our resolution of a legacy Wachovia position. Net gains from trading activities do not include interest income... -
Page 41
...associated with the mortgage servicing regulatory consent orders. Merger integration costs totaled $1.7 billion in 2011 and $1.9 billion in 2010. The integration of Wachovia remained on track, and with the successful North Carolina conversion in October 2011, all retail banking store conversions are... -
Page 42
... and Wells Fargo Home Mortgage business units. Community Banking reported net income of $9.1 billion and revenue of $50.7 billion in 2011. Revenue decreased $3.8 billion, or 7%, from 2010 due to reduced mortgage banking income, lower yields on investment securities and expected reductions in the non... -
Page 43
... for credit losses decreased $164 million, or 49%, from 2010, due to lower net charge-offs. Balance Sheet Analysis During 2011, our total assets grew 4%, funded by core deposit growth of 9% and internal capital generation, partially offset by a reduction in our long-term borrowings. Our total loans... -
Page 44
...insurer's guarantee in making the investment decision. Our municipal bond holdings continue to be monitored as part of our ongoing impairment analysis of our securities available for sale. The weighted-average expected maturity of debt securities available for sale was 4.9 years at December 31, 2011... -
Page 45
... in the "Credit Risk Management" section of this Report. Table 12: Loan Portfolios Many loan portfolios had double-digit year-over-year loan growth in average balances, including government and institutional banking, asset-backed finance, capital finance, commercial banking, commercial real estate... -
Page 46
... that contingently require us to make payments to a guaranteed party based on an event or a change in an underlying asset, liability, rate or index. Guarantees are generally in the form of standby letters of credit, securities lending and other indemnifications, liquidity agreements, written... -
Page 47
... interest rate risk management process for our customers or for other trading activities. See the "Risk Management - Asset/Liability" section and Note 16 (Derivatives) to Financial Statements in this Report for more information. Transactions with Related Parties The Related Party Disclosures topic... -
Page 48
...our credit policies and the adequacy of the allowance for credit losses. A key to our credit risk management is adherence to a well controlled underwriting process, which we believe is appropriate for the needs of our customers as well as investors who purchase the loans or securities collateralized... -
Page 49
...Pay mortgage portfolio and other PCI loans acquired from Wachovia as well as some portfolios from legacy Wells Fargo Home Equity and Table 17: Non-Strategic and Liquidating Loan Portfolios Wells Fargo Financial. Effective first quarter 2011, we added our education finance government guaranteed loan... -
Page 50
... loans with improving credit-related cash flows (3) Use of nonaccretable difference due to: Losses from loan resolutions and write-downs (4) Balance, December 31, 2009 Release of nonaccretable difference due to: Loans resolved by settlement with borrower (1) Loans resolved by sales to third parties... -
Page 51
... on PCI loans since acquisition through December 31, 2011. For additional information on PCI loans, see Note 1 (Summary of Significant Accounting Policies - Loans) and Note 6 (Loans and Allowance for Credit Losses) to Financial Statements in this Report. Other (in millions) Release of nonaccretable... -
Page 52
... 31, 2011 Real estate mortgage Nonaccrual Outstanding loans balance (1) Real estate construction Nonaccrual Outstanding loans balance (1) Total Nonaccrual Outstanding loans balance (1) % of total loans (in millions) By state: PCI loans (1): New York California Florida North Carolina Texas Other... -
Page 53
...6 (Loans and Allowance for Credit Losses) to Financial Statements in this Report for more analysis and credit metric information. Table 21: Commercial and Industrial Loans and Lease Financing by Industry December 31, 2011 % of Nonaccrual Outstanding (in millions) PCI loans (1): Technology Investors... -
Page 54
...Note 6 (Loans and Allowance for Credit Losses) to Financial Statements in this Report. FOREIGN LOANS AND EUROPEAN EXPOSURE Our foreign country risk monitoring process incorporates frequent dialogue with our foreign financial institution customers, counterparties and regulatory agencies, enhanced by... -
Page 55
... in selling and purchasing protection on the identical reference entity. Generally, we do not use market instruments such as CDS to hedge the credit risk of our investment or loan positions, although we do use them to manage risk in our trading businesses. At December 31, 2011, the gross notional... -
Page 56
...no single California metropolitan area consisting of more than 3% of total loans. We continuously monitor changes in real estate values and underlying economic or market conditions for all geographic areas of our real estate 1-4 family mortgage portfolio as part of our credit risk management process... -
Page 57
...declining home prices and increasing delinquencies, the LTV ratio is a useful metric in predicting future real estate 1-4 family first mortgage loan performance, including potential charge-offs. Because PCI loans were initially recorded at fair value, including write-downs for expected credit losses... -
Page 58
... charge-offs. (5) The ratio of carrying value to current value is calculated as the carrying value divided by the collateral value. To maximize return and allow flexibility for customers to avoid foreclosure, we have in place several loss mitigation strategies for our Pick-a-Pay loan portfolio... -
Page 59
... loss rates by the holder of the lien. Table 26: Home Equity Portfolios Performance by Holder of 1st Lien (1)(2) % of loans two payments Outstanding balance Dec. 31, Sept. 30, (in millions) First lien lines Junior lien mortgages and lines behind: Wells Fargo owned or serviced first lien Third party... -
Page 60
...-ended line reverse mortgages because they do not have scheduled payments. These reverse mortgage loans are insured by the FHA. (2) Includes $1.5 billion and $1.7 billion at December 31, 2011 and 2010, respectively, associated with the Pick-a-Pay portfolio. CREDIT CARDS Our credit card portfolio... -
Page 61
... by agencies on behalf of the U.S. Department of Education under the Federal Family Education Loan Program are not placed on nonaccrual status because they are insured or guaranteed. (5) See Note 6 (Loans and Allowance for Credit Losses) to Financial Statements in this Report for further information... -
Page 62
... Lease financing Foreign Total commercial Consumer: Real estate 1-4 family first mortgage Real estate 1-4 family junior lien mortgage Other revolving credit and installment Total consumer Total nonaccrual loans Foreclosed assets: Government insured/guaranteed Non-government insured/guaranteed... -
Page 63
... of the changes in nonaccrual loans. Quarter ended Dec. 31, (in millions) Commercial nonaccrual loans Balance, beginning of quarter Inflows Outflows: Returned to accruing Foreclosures Charge-offs Payments, sales and other (1) Total outflows Balance, end of quarter Consumer nonaccrual loans Balance... -
Page 64
... foreclosed assets portfolio one year or less. Given our real estate-secured loan concentrations and current economic conditions, we anticipate we will continue to hold a high level of NPAs on our balance sheet. We process foreclosures on a regular basis for the loans we service for others as well... -
Page 65
... the clarified guidance. The allowance for loan losses for TDRs was $5.2 billion and $3.9 billion at December 31, 2011 and 2010, respectively. See Note 6 (Loans and Allowance for Credit Losses) to Financial Statements in this Report for more information. We do not forgive principal for a majority... -
Page 66
... - Credit Risk Management (continued) Table 33 provides an analysis of the changes in TDRs. Table 33: Analysis of Changes in TDRs Quarter ended Dec. 31, (in millions) Commercial TDRs Balance, beginning of quarter Inflows Outflows Charge-offs Foreclosures Payments, sales and other (1) Balance, end of... -
Page 67
...Housing Administration (FHA) or predominantly guaranteed by the Department of Veterans Affairs (VA) for mortgages and the U.S. Department of Education for student loans under the Federal Family Education Loan Program were $20.5 billion at December 31, 2011, up from $15.8 billion at December 31, 2010... -
Page 68
...Charge-offs Year ended December 31, Net loan charge($ in millions) 2011 Commercial: Commercial and industrial Real estate mortgage Real estate construction Lease financing Foreign Total commercial Consumer: Real estate 1-4 family first mortgage Real estate 1-4 family junior lien mortgage Credit card... -
Page 69
.... Net charge-offs in 2011 were $11.3 billion (1.49% of average total loans outstanding) compared with $17.8 billion (2.30%) in 2010. Total net chargeoffs decreased in 2011 due in part to modestly improving economic conditions, aggressive loss mitigation activities aimed at working with our customers... -
Page 70
... yearend levels. Total provision for credit losses was $7.9 billion in 2011, $15.8 billion in 2010 and $21.7 billion in 2009. The 2011 provision was $3.4 billion less than net charge-offs. Primary drivers of the 2011 provision reduction were decreased net charge-offs and continued improvement in the... -
Page 71
... for Credit Losses (ACL) December 31, 2011 Loans as % (in millions) Commercial: Commercial and industrial Real estate mortgage Real estate construction Lease financing Foreign Total commercial Consumer: Real estate 1-4 family first mortgage Real estate 1-4 family junior lien mortgage Credit card... -
Page 72
... institutions that purchase mortgage loans for investment or private label securitization. In addition, we pool FHA-insured and VA-guaranteed mortgage loans that back securities guaranteed by GNMA. We may be required to repurchase these mortgage loans, indemnify the securitization trust, investor or... -
Page 73
... securitizations in 2011. Of the servicing portfolio, 4% is nonagency acquired servicing and 2% is private whole loan sales. We did not underwrite and securitize the non-agency acquired servicing and therefore we have no obligation on that portion of our servicing portfolio to the investor for any... -
Page 74
Risk Management - Credit Risk Management (continued) Table 38: Changes in Mortgage Repurchase Liability Quarter ended Dec. 31, (in millions) Balance, beginning of period Provision for repurchase losses: Loan sales Change in estimate (1) Total additions Losses Balance, end of period $ 27 377 404 (272... -
Page 75
... SEC, (4) if required by the securitization documents, calculate distributions and loss allocations on the mortgage-backed securities, (5) prepare tax and information returns of the securitization trust, and (6) advance amounts required by non-affiliated servicers who fail to perform their advancing... -
Page 76
... a loan owned and serviced by Wells Fargo, a commitment to provide $3.4 billion in aggregate consumer relief and assistance programs, including expanded first and second mortgage modifications that broaden the use of principal reduction to help customers achieve affordability, an expanded short sale... -
Page 77
... lien loans: 20% to 100% credit depending on whether the servicer, servicer/lien holder or investor incurs the loss; payment arrearages forgiveness for unemployed borrowers: 100% credit; transitional funds paid to homeowners in connection with a short sale or deed-in-lieu of foreclosure for payments... -
Page 78
... be changed and the rate reduction can be executed via a modification of the existing loan terms or a refinance into a new loan. The new loan or modified loan must be a fully amortizing product and the new interest rate will be capped at 100 basis points over the Freddie Mac current primary mortgage... -
Page 79
... Mae, Freddie Mac, Ginnie Mae, the Federal Home Loan Bank, the SEC, the CFPB (after July 21, 2011) and the federal banking agencies. Additional information on risks and litigation relating to servicing activities is included in Note 15 (Legal Actions) to Financial Statements in this Report. 77 -
Page 80
... 31, 2011 and 2010, are presented in Note 16 (Derivatives) to Financial Statements in this Report. We use derivatives for asset/liability management in three main ways: to convert a major portion of our long-term fixed-rate debt, which we issue to finance the Company, from fixedrate payments to... -
Page 81
... interest rate risk. Under this method, the MSRs are recorded at fair value at the time we sell or securitize the related mortgage loans. The carrying value of MSRs carried at fair value reflects changes in fair value at the end of each quarter and changes are included in net servicing income... -
Page 82
... relationships between underlying loan value and the derivative financial instruments that cannot be hedged. MARKET RISK - TRADING ACTIVITIES From a market risk perspective, our net income is exposed to changes in interest rates, credit spreads, foreign exchange rates, equity and commodity prices... -
Page 83
... losses reported in noninterest income. As part of our business to support our customers, we trade public equities, listed/OTC equity derivatives and convertible bonds. We have risk mandates that govern these activities. We also have marketable equity securities in the securities available-for-sale... -
Page 84
... relatively stable and low-cost funds. At December 31, 2011, core deposits funded 113% of total loans compared with 105% a year ago. Additional funding is provided by longterm debt (including trust preferred securities), other foreign deposits, and short-term borrowings. Long-term debt averaged $141... -
Page 85
... Bond Rating Service (DBRS) confirmed both the Parent's and Wells Fargo Bank, N.A.'s long-term senior and short-term debt ratings, including the stable trend. The Moody's and S&P's Table 42: Credit Ratings ratings downgrades have not adversely affected our ability to access the capital markets... -
Page 86
... Management - Asset/Liability Management (continued) At December 31, 2011, Wells Fargo Bank, N.A. had available $100 billion in short-term debt issuance authority and $103.7 billion in long-term debt issuance authority. Wells Fargo Canada Corporation In January 2012, Wells Fargo Canada Corporation... -
Page 87
... our capital requirements, the number of shares we expect to issue for employee benefit plans and acquisitions, market conditions (including the trading price of our stock), and regulatory and legal considerations, including the FRB's response to our capital plan. In 2008, the Board authorized the... -
Page 88
...assets anticipated under Basel III (C) (D) (C)/(D) $ $ 3.1 (0.1) (0.2) 97.9 1,304.7 7.50 % $ 2011 95.1 (1) Tier 1 common equity is a non-GAAP financial measure that is used by investors, analysts and bank regulatory agencies to assess the capital position of financial services companies. Management... -
Page 89
... FRB's new rules, our fourth quarter 2011 debit card interchange fees were reduced by $365 million (pre-tax). Interest on business checking (Regulation Q repeal). Effective July 21, 2011, banks are permitted to pay interest on business checking accounts. We made changes to our affected products in... -
Page 90
...to-equity limits, and early remediation requirements for large BHCs like Wells Fargo. The Dodd-Frank Act also establishes the Financial Services Oversight Council and the Office of Financial Research, which may recommend new systemic risk management requirements and require new reporting of systemic... -
Page 91
...business group exercises significant judgment in the determination of the credit loss estimation model that fits the credit risk characteristics of its portfolio. We use both internally developed and vendor supplied models in this process. We often use roll rate or net flow models for near-term loss... -
Page 92
... for credit losses relies on a consistent quarterly process that requires significant management review and judgment. Management considers changes in economic conditions, customer behavior, and collateral value, among other influences. From time to time, economic factors or business decisions... -
Page 93
... MSRs related to residential mortgage loans at fair value. At the end of each quarter, we determine the fair value of MSRs using a valuation model that calculates the present value of estimated future net servicing income. The model incorporates assumptions that market participants use in estimating... -
Page 94
... forms of settlement through our underwriting and quality assurance practices and by servicing mortgage loans to meet investor and secondary market standards. We establish mortgage repurchase liabilities related to various representations and warranties that reflect management's estimate of losses... -
Page 95
...Valuation is based upon quoted prices for identical instruments traded in active markets. Level 1 instruments include securities traded on active exchange markets, such as the New York Stock Exchange, as well as U.S. Treasury and other U.S. government securities that are traded by dealers or brokers... -
Page 96
... be material to our operating results for any given quarter. See Note 21 (Income Taxes) to Financial Statements in this Report for a further description of our provision for income taxes and related income tax assets and liabilities. ($ in billions) Assets carried at fair value As a percentage of... -
Page 97
... fair value on a net basis for financial instruments that are managed based on net exposure to market risks and/or counterparty credit risk. ASU 2011-04 requires new disclosures for financial instruments classified as Level 3, including: 1) quantitative information about unobservable inputs used in... -
Page 98
... losses; disruptions in the capital markets and reduced investor demand for mortgage loans; our ability to sell more products to our customers; the effect of a fall in stock market prices on our investment banking business and our fee income from our brokerage, asset and wealth management businesses... -
Page 99
...operational or security systems or infrastructure, or those of our third party vendors and other service providers, including as a result of cyber attacks; the loss of checking and savings account deposits to other investments such as the stock market, and the resulting increase in our funding costs... -
Page 100
...other investment advisory and wealth management services. Because investment management fees are often based on the value of assets under management, a fall in the market prices of those assets could reduce our fee income. Changes in stock market prices could affect the trading activity of investors... -
Page 101
.... Our net income also is exposed to changes in interest rates, credit spreads, foreign exchange rates, equity and commodity prices in connection with our trading activities, which are conducted primarily to accommodate our customers in the management of their market price risk, as well as when... -
Page 102
... net interest margin and net interest income. Checking and savings account balances and other forms of customer deposits may decrease when customers perceive alternative investments, such as the stock market, as providing a better risk/return tradeoff. When customers move money out of bank deposits... -
Page 103
...trust preferred securities; (x) permitted banks to pay interest on business checking accounts beginning on July 1, 2011; (xi) authorized the FRB under the Durbin Amendment to adopt regulations that limit debit card interchange fees received by debit card issuers; and (xii) includes several corporate... -
Page 104
... new rules limiting debit card interchange fees, our fourth quarter 2011 debit card interchange fees were reduced by $365 million (pre-tax). Although we expect to recapture a portion of our lost income over time through volume and product changes, there can be no assurance that we will be successful... -
Page 105
...our cost of funds for lending and investing and the return we earn on those loans and investments, both of which affect our net interest income and net interest margin. The FRB's interest rate policies also can materially affect the value of financial instruments we hold, such as debt securities and... -
Page 106
... who have foreign operations. For more information, refer to the "Risk Management - Credit Risk Management" section and Note 6 (Loans and Allowance for Credit Losses) to Financial Statements in this Report. We may incur losses on loans, securities and other acquired assets of Wachovia that are... -
Page 107
...to exist in their current form, as well as any effect on the Company's business and financial results, are uncertain. For more information, refer to the "Risk Management - Asset/Liability Management - Mortgage Banking Interest Rate and Market Risk" and "Critical Accounting Policies" sections in this... -
Page 108
... first and second lien mortgage modifications that broaden the use of principal reduction to help customers achieve affordability, an expanded short sale program that includes waivers of deficiency balances, forgiveness of arrearages for unemployed borrowers, cash-for-keys payments to borrowers who... -
Page 109
... or operating systems that support our businesses and customers. Information security risks for large financial institutions such as Wells Fargo have generally increased in recent years in part because of the proliferation of new technologies, the use of the Internet and telecommunications... -
Page 110
..., including mortgage lending practices, servicing and foreclosure activities, corporate governance, regulatory compliance, mergers and acquisitions, and disclosure, sharing or inadequate protection of customer information, and from actions taken by government regulators and community or other... -
Page 111
... in retail banking and mortgage lending. This can limit our ability to sell more products to our customers or influence us to sell our products at lower prices, reducing our net interest income and revenue from our fee-based products. It could also affect our ability to keep existing customers. New... -
Page 112
... and liabilities, available-for-sale securities, certain loans, MSRs, private equity investments, structured notes and certain repurchase and resale agreements, among other items, require a determination of their fair value in order to prepare our financial statements. Where quoted market prices are... -
Page 113
... in higher than expected deposit attrition, loss of key team members, disruption of our business or the business of the acquired company, or otherwise harm our ability to retain customers and team members or achieve the anticipated benefits of the acquisition. Time and resources spent on integration... -
Page 114
... of management and directors of the Company; and provide reasonable assurance regarding prevention or timely detection of unauthorized acquisition, use or disposition of the Company's assets that could have a material effect on the financial statements. Because of its inherent limitations, internal... -
Page 115
...income, changes in equity and comprehensive income, and cash flows for each of the years in the three-year period ended December 31, 2011, and our report dated February 28, 2012, expressed an unqualified opinion on those consolidated financial statements. San Francisco, California February 28, 2012... -
Page 116
... for credit losses Noninterest income Service charges on deposit accounts Trust and investment fees Card fees Other fees Mortgage banking Insurance Net gains from trading activities Net gains (losses) on debt securities available for sale (1) Net gains from equity investments (2) Operating leases... -
Page 117
..., except shares) Assets Cash and due from banks Federal funds sold, securities purchased under resale agreements and other short-term investments Trading assets Securities available for sale Mortgages held for sale (includes $44,791 and $47,531 carried at fair value) Loans held for sale (includes... -
Page 118
Wells Fargo & Company and Subsidiaries Consolidated Statement of Changes in Equity and Comprehensive Income Preferred stock (in millions, except shares) Balance December 31, 2008 Cumulative effect from change in accounting for other-than-temporary impairment on debt securities Effect of change in ... -
Page 119
Wells Fargo stockholders' equity Additional paid-in capital 36,026 Cumulative other comprehensive income (6,869) (...889 Unearned ESOP shares (555) Total Wells Fargo stockholders' equity 99,084 Retained earnings 36,543 53 Treasury stock (4,666) Noncontrolling interests 3,232 Total equity 102,316 ... -
Page 120
... pages) Wells Fargo & Company and Subsidiaries Consolidated Statement of Changes in Equity and Comprehensive Income (in millions, except shares) Balance December 31, 2010 Shares 10,185,303 Preferred stock Amount $ 8,689 Shares 5,262,283,228 Common stock Amount $ 8,787 Balance January 1, 2011... -
Page 121
Wells Fargo stockholders' equity Additional paid-in capital 53,426 Cumulative other comprehensive income 4,738 Unearned ESOP shares (663) Total Wells Fargo stockholders' equity 126,408 Retained earnings 51,918 Treasury stock (487) Noncontrolling interests 1,481 Total equity 127,889 53,426 51,... -
Page 122
... Excess tax benefits related to stock option payments Originations of MHFS Proceeds from sales of and principal collected on mortgages originated for sale Originations of LHFS Proceeds from sales of and principal collected on LHFS Purchases of LHFS Net change in: Trading assets Deferred income taxes... -
Page 123
...the end of this Report for terms used throughout the Financial Statements and related Notes of this Form 10-K. Note 1: Summary of Significant Accounting Policies Wells Fargo & Company is a diversified financial services company. We provide banking, insurance, trust and investments, mortgage banking... -
Page 124
...Bank and other depository institutions. Trading Assets Trading assets are primarily securities, including corporate debt, U.S. government agency obligations and other securities that we acquire for short-term appreciation or other trading purposes, and the fair value of derivatives held for customer... -
Page 125
...rate risk and maximize portfolio yield within capital risk limits approved by management and the Board of Directors and monitored by the Corporate Asset/Liability Management Committee (Corporate ALCO). We recognize realized gains and losses on the sale of these securities in noninterest income using... -
Page 126
..., loan costs and fees are deferred at origination and are recognized in mortgage banking noninterest income at time of sale. Interest income on MHFS for which the fair value option is elected is calculated based upon the note rate of the loan and is recorded to interest income. Our lines of business... -
Page 127
... banking regulatory agencies; the customer has filed bankruptcy and the loss becomes evident owing to a lack of assets; or the loan is 180 days past due unless both well-secured and in the process of collection. PCI loans are written down at acquisition to fair value using an estimate of cash flows... -
Page 128
... difficulty early and work with them to modify their loan to more affordable terms before it reaches nonaccrual status. These modified terms may include rate reductions, principal forgiveness, term extensions, payment forbearance and other actions intended to minimize our economic loss and to avoid... -
Page 129
...value of estimated future net servicing income cash flows. We estimate future net servicing income cash flows with assumptions that market participants would use to estimate fair value, including estimates of prepayment speeds (including housing price volatility), discount rates, default rates, cost... -
Page 130
... cash flows expected to result from the lease payments and the estimated residual value upon the eventual disposition of the equipment. Liability for Mortgage Loan Repurchase Losses We sell residential mortgage loans to various parties, including (1) Freddie Mac and Fannie Mae (government... -
Page 131
... our open-market common stock repurchase strategies, to allow us to manage our share repurchases in a manner consistent with our 2011 Federal Reserve Board (FRB) Comprehensive Capital Analysis and Review plan (capital plan), and to provide an economic benefit to the Company. In connection with each... -
Page 132
... foreclosed assets Changes in consolidations of variable interest entities: Trading assets Securities available for sale Loans Other assets Short-term borrowings Long-term debt Accrued expenses and other liabilities Net transfer from additional paid-in capital to noncontrolling interests Decrease in... -
Page 133
..., 2010 and 2009 are presented below. At December 31, 2011, we had two acquisitions pending, both of which are expected to close during first quarter 2012 with combined total assets of approximately $835 million. (in millions) 2011 CP Equity, LLC, Denver, Colorado Certain assets of Foreign Currency... -
Page 134
... as a result of any significant acquisitions. The Company submitted its board-approved 2012 capital plan to the FRB on January 6, 2012. Note 4: Federal Funds Sold, Securities Purchased under Resale Agreements and Other Short-Term Investments The following table provides the detail of federal... -
Page 135
... by home equity loans with a cost basis and fair value of $846 million and $932 million, respectively, at December 31, 2011, and $927 million and $1.1 billion, respectively, at December 31, 2010. The remaining balances primarily include asset-backed securities collateralized by credit cards and... -
Page 136
...fair value declined to below the cost basis and not the period of time since the credit-related OTTI write-down. Less than 12 months Gross unrealized (in millions) December 31, 2011 Securities of U.S. Treasury and federal agencies Securities of U.S. states and political subdivisions Mortgage-backed... -
Page 137
... other debt securities primarily relate to other asset-backed securities. The losses are primarily driven by changes in projected collateral losses, credit spreads and interest rates. We assess for credit impairment by estimating the present value of expected cash flows. The key assumptions for... -
Page 138
... based on the internal credit grade of the securities (used for credit risk management purposes) equivalent to the credit rating assigned by major credit agencies. The unrealized losses and fair value of unrated securities categorized as investment grade based on internal credit grades were $207... -
Page 139
... maturities because borrowers may have the right to prepay obligations before the underlying mortgages mature. Remaining contractual principal maturity WeightedTotal (in millions) December 31, 2011 Securities of U.S. Treasury and federal agencies Securities of U.S. states and political subdivisions... -
Page 140
... the gross realized gains and losses on sales and OTTI write-downs related to the securities availablefor-sale portfolio, which includes marketable equity securities, as well as net realized gains and losses on nonmarketable equity securities (see Note 7 - Other Assets). Year ended December 31, (in... -
Page 141
... sold For securities derecognized due to changes in consolidation status of variable interest entities Due to change in intent to sell or requirement to sell For recoveries of previous credit impairments (1) Total reductions Credit loss component, end of year $ $ 2011 1,043 87 335 422 2010 1,187 122... -
Page 142
... the year ended December 31, 2011, had expected remaining life of loan loss assumptions of 0 to 10%. (4) Calculated by weighting the relevant input/assumption for each individual security by current outstanding amortized cost basis of the security. (5) Represents current level of credit protection... -
Page 143
... in California, with no single area consisting of more than 3% of total loans. We continuously monitor changes in real estate values and underlying economic or market conditions for all geographic areas of our real estate 1-4 family mortgage portfolio as part of our credit risk management process... -
Page 144
... in government insured/guaranteed loans where Wells Fargo acts as servicer. On a net basis, this activity was $10.4 billion and $7.0 billion for the year ended December 31, 2011 and 2010, respectively. Commitments to Lend A commitment to extend credit is a legally binding agreement to lend funds to... -
Page 145
... as economic conditions. COMMERCIAL PORTFOLIO SEGMENT ACL METHODOLOGY delinquent first lien mortgages into our loss forecasting calculations. In addition, the loss rates we use in determining our allowance include the impact of our established loan modification programs. When modifications occur... -
Page 146
... mortgage Real estate construction Lease financing Foreign Total commercial Consumer: Real estate 1-4 family first mortgage Real estate 1-4 family junior lien mortgage Credit card Other revolving credit and installment Total consumer Total loan recoveries Net loan charge-offs (2) Allowances related... -
Page 147
... portfolio segments. 2011 (in millions) Year ended December 31, Balance, beginning of year Provision for credit losses Interest income on certain impaired loans Loan charge-offs Loan recoveries Net loan charge-offs Allowance related to business combinations/other Balance, end of year $ $ 8,169 365... -
Page 148
...63,460 314,123 7,935 322,058 The following table provides past due information for commercial loans, which we monitor as part of our credit risk management practices. Commercial (in millions) December 31, 2011 By delinquency status: Current-29 DPD and still accruing 30-89 DPD and still accruing 90... -
Page 149
... 31, 2011, compared with $6.8 billion, or 3.4%, at December 31, 2010. The aging of the delinquent real estate 1-4 family first mortgage loans is a result of the prolonged foreclosure process and our effort to help customers stay in their homes through various loan modification programs, as loans... -
Page 150
... insured/guaranteed loans. LTV refers to the ratio comparing the loan's balance to the property's collateral value. CLTV refers to the combination of first mortgage and junior lien mortgage (including unused line amounts for credit line products) ratios. LTVs and CLTVs are updated quarterly using... -
Page 151
... the loss content would generally be limited to only the amount in excess of 100% LTV/CLTV. (3) Represents loans whose repayments are insured by the FHA or guaranteed by the VA. In 2011, we consolidated $5.6 billion of previously sold FHA insured real estate 1-4 family reverse mortgages. NONACCRUAL... -
Page 152
...Housing Administration (FHA) or predominantly guaranteed by the Department of Veterans Affairs (VA) for mortgages and the U.S. Department of Education for student loans under the Federal Family Education Loan Program were $20.5 billion at December 31, 2011, up from $15.8 billion at December 31, 2010... -
Page 153
... Lease financing Foreign Total commercial Consumer: Real estate 1-4 family first mortgage Real estate 1-4 family junior lien mortgage Credit card Other revolving credit and installment Total consumer Total impaired loans (excluding PCI) $ balance Impaired loans with related allowance for credit... -
Page 154
... Lease financing Foreign Total commercial Consumer: Real estate 1-4 family first mortgage Real estate 1-4 family junior lien mortgage Credit card Other revolving credit and installment Total consumer Total impaired loans $ investment Recognized interest income Average recorded investment 2010... -
Page 155
... Weighted average interest rate reduction Recorded investment related to interest rate reduction (in millions) Year ended December 31, 2011 Commercial: Commercial and industrial Real estate mortgage Real estate construction Lease financing Foreign Total commercial Consumer: Real estate 1-4 family... -
Page 156
.... Year ended December 31, 2011 Recorded investment (in millions) Commercial: Commercial and industrial Real estate mortgage Real estate construction Lease financing Foreign Total commercial Consumer: Real estate 1-4 family first mortgage Real estate 1-4 family junior lien mortgage Credit card Other... -
Page 157
... into noninterest income due to sales (2) Reclassification from nonaccretable difference for loans with improving credit-related cash flows Changes in expected cash flows that do not affect nonaccretable difference (3) Total, end of year $ $ 2011 16,714 128 (2,206) (189) 373 1,141 15,961 2010 14,559... -
Page 158
...of loans, with a charge to income through the provision for losses. The following table summarizes the changes in allowance for PCI loan losses. (in millions) Balance, December 31, 2008 Provision for losses due to credit deterioration Charge-offs Balance, December 31, 2009 Provision for losses due... -
Page 159
... status of consumer PCI loans. December 31, 2011 Real estate Real estate 1-4 family first (in millions) By delinquency status: Current-29 DPD 30-59 DPD 60-89 DPD 90-119 DPD 120-179 DPD 180+ DPD Total consumer PCI loans (adjusted unpaid principal balance) $ Total consumer PCI loans (carrying value... -
Page 160
... 31, 2011 December 31, 2010 Real estate Real estate 1-4 family first (in millions) By FICO: < 600 600-639 640-679 680-719 720-759 760-799 800+ No FICO available Total consumer PCI loans (adjusted unpaid principal balance) $ Total consumer PCI loans (carrying value) $ mortgage 1-4 family junior... -
Page 161
...ended December 31, 2012 2013 2014 2015 2016 Thereafter Total minimum lease payments Executory costs Amounts representing interest Present value of net minimum lease payments $ $ $ 1,319 1,216 1,075 872 717 3,239 8,438 $ leases Capital leases (1) Represents low income housing tax credit investments... -
Page 162
... liquidity facilities to support short-term obligations of SPEs issued to third party investors; • providing credit enhancement on securities issued by SPEs or market value guarantees of assets held by SPEs through the use of letters of credit, financial guarantees, credit default swaps and... -
Page 163
... 31, 2011 Cash Trading assets Securities available for sale (1) Mortgages held for sale Loans Mortgage servicing rights Other assets Total assets Short-term borrowings Accrued expenses and other liabilities Long-term debt Total liabilities Noncontrolling interests Net assets December 31, 2010 Cash... -
Page 164
..., 2011 Carrying value - asset (liability) Residential mortgage loan securitizations: Conforming Other/nonconforming Commercial mortgage loan securitizations Collateralized debt obligations: Debt securities Loans (2) Asset-based finance structures Tax credit structures Collateralized loan obligations... -
Page 165
... agencies at December 31, 2011. These senior loans were acquired in the Wachovia business combination and are accounted for at amortized cost as initially determined under purchase accounting and are subject to the Company's allowance and credit charge-off policies. (3) Includes structured financing... -
Page 166
... to limited liability related to recourse agreements and repurchase agreements we make to our issuers and purchasers, which are included in other commitments and guarantees. In certain instances, we may service residential mortgage loan securitizations structured by third parties whose loans we... -
Page 167
... management of the assets and are the sole investor in these funds. At December 31, 2010, we had investments of $1.4 billion and lending arrangements of $14 million with this fund. OTHER TRANSACTIONS WITH VIEs In 2008, legacy Wachovia reached an agreement to purchase at par auction rate securities... -
Page 168
... ended December 31, 2011 Other financial assets 11 263 2010 Other financial assets 34 442 2009 Other financial assets 42 310 - Mortgage (in millions) Sales proceeds from securitizations (1) Servicing fees Other interests held Purchases of delinquent assets Net servicing advances (1) Represents cash... -
Page 169
... rating agency at issuance. The information presented excludes trading positions held in inventory. Other interests held Mortgage servicing (in millions) Fair value of interests held at December 31, 2011 Expected weighted-average life (in years) Prepayment speed assumption (annual CPR) Decrease... -
Page 170
... 9,174 569 569 738 (1) 738 2011 2010 Delinquent loans December 31, 2011 2010 Year ended December 31, 2011 2010 (1) Balances have been revised to correct previously reported amounts. (2) Balances have been revised to conform with current period presentation of including loans sold to FNMA, GNMA, and... -
Page 171
... loan securitizations Structured asset finance Investment funds Other Total consolidated VIEs Total secured borrowings and consolidated VIEs December 31, 2010 Secured borrowings: Municipal tender option bond securitizations Auto loan securitizations Commercial real estate loans Residential mortgage... -
Page 172
... 2011, we redeemed our interest in an unconsolidated investment fund and placed the assets received upon redemption into new VIEs. We consolidate these VIEs because we have discretion over the management of the assets and are the sole investor in these funds. nonconforming residential mortgage loan... -
Page 173
...cash flows over time. The changes in amortized MSRs were: Year ended December 31, (in millions) Balance, beginning of year Adjustments from adoption of consolidation accounting guidance Purchases Acquired from Wachovia (1) Servicing from securitizations or asset transfers Amortization Balance, end... -
Page 174
... components of mortgage banking noninterest income were: Year ended December 31, (in millions) Servicing income, net: Servicing fees: Contractually specified servicing fees Late charges Ancillary fees Unreimbursed direct servicing costs (1) Net servicing fees Changes in fair value of MSRs carried... -
Page 175
... losses: Loan sales Change in estimate (2) Total additions Losses Balance, end of year $ $ 2011 1,289 101 1,184 1,285 (1,248) 1,326 2010 1,033 144 1,474 1,618 (1,362) 1,289 2009 589 31 302 625 958 (514) 1,033 (1) The 2009 amount is refinement to initial December 31, 2008, Wachovia purchase... -
Page 176
... from these projections. The following table provides the current year and estimated future amortization expense for amortized intangible assets. Customer Amortized (in millions) Year ended December 31, 2011 (actual) Estimate for year ended December 31, 2012 2013 2014 2015 2016 $ 226 194 165 149... -
Page 177
... in 2010 was predominately due to reversals of excess exit reserves. Wealth, (in millions) December 31, 2009 Goodwill from business combinations, net December 31, 2010 Reduction in goodwill related to divested businesses Goodwill from business combinations December 31, 2011 $ $ Community Banking 17... -
Page 178
... Total Year ended December 31, Average daily balance Commercial paper and other short-term borrowings Federal funds purchased and securities sold under agreements to repurchase Total Maximum month-end balance Commercial paper and other short-term borrowings (1) Federal funds purchased and securities... -
Page 179
... - income trust securities Total junior subordinated debt - Parent (3) Total long-term debt - Parent Wells Fargo Bank, N.A. and other bank entities (Bank) Senior Fixed-rate notes Floating-rate notes Fixed-rate advances - Federal Home Loan Bank (FHLB) Floating-rate advances - FHLB Market-linked notes... -
Page 180
... the Federal Deposit Insurance Corporation's (FDIC) Temporary Liquidity Guarantee Program (TLGP) and are backed by the full faith and credit of the United States. (2) Primarily consists of long-term notes where the performance of the note is linked to an embedded equity, commodity, or currency index... -
Page 181
... that contingently require us to make payments to a guaranteed party based on an event or a change in an underlying asset, liability, rate or index. Guarantees are generally in the form of standby letters of credit, securities lending and other indemnifications, liquidity agreements, written... -
Page 182
... See Note 9 for additional information on the liability for mortgage loan repurchase losses. RESIDUAL VALUE GUARANTEES We have provided residual Pledged Assets and Collateral As part of our liquidity management strategy, we pledge assets to secure trust and public deposits, borrowings from the FHLB... -
Page 183
... case asserted claims against several Wells Fargo mortgage backed securities trusts, Wells Fargo Bank, N.A. and other affiliated entities, individual employee defendants, along with various underwriters and rating agencies. The plaintiffs alleged that the offering documents contain untrue statements... -
Page 184
... a loan owned and serviced by Wells Fargo, a commitment to provide $3.4 billion in aggregate consumer relief and assistance programs, including expanded first and second mortgage modifications that broaden the use of principal reduction to help customers achieve affordability, an expanded short sale... -
Page 185
... EQUITY SECURITIES AND BONDS/NOTES LITIGATION A The DOJ and the SEC, beginning in November 2006, requested information from a number of financial institutions, including Wachovia Bank, N.A.'s municipal derivatives group, with regard to competitive bid practices in the municipal derivative markets... -
Page 186
... be material to Wells Fargo's results of operations for any particular period. Note 16: Derivatives We use derivatives to manage exposure to market risk, interest rate risk, credit risk and foreign currency risk, to generate profits from proprietary trading and to assist customers with their risk... -
Page 187
...-rate swaps and designated as one hedging instrument. (2) Includes free-standing derivatives (economic hedges) used to hedge the risk of changes in the fair value of residential MSRs, MHFS, and other interests held. (3) Represents netting of derivative asset and liability balances, and related cash... -
Page 188
... of high effectiveness. The following table shows the net gains (losses) recognized in the income statement related to derivatives in fair value hedging relationships. Interest rate contracts hedging: Securities Mortgages available (in millions) Year ended December 31, 2011 Gains (losses) recorded... -
Page 189
... derivatives was a net asset of $1.4 billion at December 31, 2011, and a net liability of $943 million at December 31, 2010. Changes in fair value of debt securities available for sale (unrealized gains and losses) are not included in servicing income, but are reported in cumulative OCI (net of tax... -
Page 190
... (2) Subtotal Net gains (losses) recognized on customer accommodation, trading and other free-standing derivatives: Interest rate contracts Recognized in noninterest income: Mortgage banking (3) Other (4) Commodity contracts (4) Equity contracts (4) Foreign exchange contracts (4) Credit contracts... -
Page 191
...and purchased credit derivatives. Notional amount Protection sold non(in millions) December 31, 2011 Credit default swaps on: Corporate bonds Structured products Credit protection on: Default swap index Commercial mortgagebacked securities index Asset-backed securities index Loan deliverable credit... -
Page 192
...The security classes where we consider the market to be less orderly include primarily non-agency residential MBS. The methodology used to adjust the quotes involved weighting the 190 price quotes and results of internal pricing techniques such as the net present value of future expected cash flows... -
Page 193
... sale are recorded at fair value on a recurring basis. Fair value measurement is based upon quoted prices in active markets, if available. Such instruments are classified within Level 1 of the fair value hierarchy. Examples include exchange-traded equity securities and some highly liquid government... -
Page 194
... credit default swap model. DERIVATIVES Quoted market prices are available and used for Note 1. Although most loans are not recorded at fair value on a recurring basis, reverse mortgages, which were previously sold under a GNMA securitization program and were consolidated during fourth quarter 2011... -
Page 195
.... The discount rate is estimated using the rates currently offered for like wholesale deposits with similar remaining maturities. SHORT-TERM FINANCIAL LIABILITIES Short-term financial liabilities are carried at historical cost and include federal funds purchased and securities sold under repurchase... -
Page 196
... third party pricing services that we have adjusted to determine the fair value recorded in our financial statements are not included in the following table. Independent brokers (in millions) December 31, 2011 Trading assets (excluding derivatives) Securities available for sale: Securities of... -
Page 197
... assets recorded at fair value Derivative liabilities: Interest rate contracts Commodity contracts Equity contracts Foreign exchange contracts Credit contracts Other derivative contracts Netting Total derivative liabilities (6) Short sale liabilities: Securities of U.S. Treasury and federal agencies... -
Page 198
... assets recorded at fair value Derivative liabilities: Interest rate contracts Commodity contracts Equity contracts Foreign exchange contracts Credit contracts Other derivative contracts Netting Total derivative liabilities (6) Short sale liabilities: Securities of U.S. Treasury and federal agencies... -
Page 199
... preferred securities Other marketable equity securities Total marketable equity securities Total securities available for sale Mortgages held for sale Loans Mortgage servicing rights Net derivative assets and liabilities: Interest rate contracts Commodity contracts Equity contracts Foreign exchange... -
Page 200
... presents gross purchases, sales, issuances and settlements related to the changes in Level 3 assets and liabilities measured at fair value on a recurring basis for the year ended December 31, 2011. (in millions) Year ended December 31, 2011 Trading assets (excluding derivatives): Securities of... -
Page 201
... sale Loans Mortgage servicing rights Net derivative assets and liabilities: Interest rate contracts Commodity contracts Equity contracts Foreign exchange contracts Credit contracts Other derivative contracts Total derivative contracts Other assets Short sale liabilities (corporate debt securities... -
Page 202
...over time. (2) Included in trading activities and other noninterest income in the income statement. (3) Included in debt securities available for sale in the income statement. (4) Included in equity investments in the income statement. (5) Included in mortgage banking and other noninterest income in... -
Page 203
... at year end. Carrying value at year end (in millions) December 31, 2011 Mortgages held for sale (1) Loans held for sale Loans: Commercial Consumer Total loans (2) Mortgage servicing rights (amortized) Other assets (3) December 31, 2010 Mortgages held for sale (1) Loans held for sale Loans... -
Page 204
...fair value adjustment has been included in the income statement. (in millions) Year ended December 31, 2011 Mortgages held for sale Loans held for sale Loans: Commercial Consumer Total loans (1) Mortgage servicing rights (amortized) Other assets (2) Total Year ended December 31, 2010 Mortgages held... -
Page 205
... at fair value for prime MHFS originations for which an active secondary market and readily available market prices exist to reliably support fair value pricing models used for these loans. Loan origination fees on these loans are recognized when earned, and related direct loan origination costs are... -
Page 206
...measurement and subsequent changes in fair value included in earnings for these assets measured at fair value are shown, by income statement line item, below. 2011 Net gains Mortgage banking (in millions) Year ended December 31, Mortgages held for sale Loans held for sale Loans Long-term debt Other... -
Page 207
... construed to represent, the underlying value of the Company. December 31, 2011 Carrying (in millions) Financial assets Mortgages held for sale (1) Loans held for sale (2) Loans, net (3) Nonmarketable equity investments (cost method) Financial liabilities Deposits Long-term debt (4) $ 3,566 162 731... -
Page 208
...December 31, 2011 Liquidation preference Shares authorized Liquidation preference per share 2010 Shares authorized and designated per share and designated DEP Shares Dividend Equalization Preferred Shares Series A Non-Cumulative Perpetual Preferred Stock Series B Non-Cumulative Perpetual Preferred... -
Page 209
... are payable quarterly at annual rates based upon the year of issuance. Each share of ESOP Preferred Stock released from the unallocated reserve of the 401(k) Plan is converted into shares of our common stock based on the stated value of the ESOP Preferred Stock and the then current market price of... -
Page 210
... and common stock direct purchase plans may purchase shares of our common stock at fair market value under the terms of the plan. Employee Stock Plans We offer stock based employee compensation plans as described below. We measure the cost of employee services received in exchange for an... -
Page 211
...CPP investment in Wells Fargo in December 2009. No salary increases were paid in common stock after March 2010. For various acquisitions and mergers, we converted employee and director stock options of acquired or merged companies into stock options to purchase our common stock based on the terms of... -
Page 212
... amount and timing of our share repurchases, including our capital requirements, the number of shares we expect to issue for acquisitions and employee benefit plans, market conditions (including the trading price of our stock), and regulatory and legal considerations. These factors can change at any... -
Page 213
...Year ended December 31, 2011 Per share fair value of options granted Expected volatility Expected dividends Expected term (in years) Risk-free interest rate $ $ 3.78 32.7 % 0.32 1.0 0.2 % 2010 6.11 44.3 0.20 1.3 0.6 2009 3.29 53.9 0.33 4.5 1.8 Employee Stock Ownership Plan The Wells Fargo & Company... -
Page 214
... year Service cost Interest cost Plan participants' contributions Actuarial loss (gain) Benefits paid Curtailment Amendments Liability transfer Foreign exchange impact Benefit obligation at end of year Change in plan assets: Fair value of plan assets at beginning of year Actual return on plan assets... -
Page 215
... cost Interest cost Expected return on plan assets Amortization of net actuarial loss Amortization of prior service cost Settlement Loss Curtailment loss (gain) Net periodic benefit cost Other changes in plan assets and benefit obligations recognized in other comprehensive income: Net actuarial loss... -
Page 216
... we use health care cost trend rates to recognize the effect of expected changes in future health care costs due to medical inflation, utilization changes, new technology, regulatory requirements and Medicare cost shifting. In determining the end of year benefit obligation we assume average annual... -
Page 217
... the pension plans and their funded status. Our overall investment strategy is designed to provide our Cash Balance Plan with a balance of long-term growth opportunities and short-term benefit strategies while ensuring that risk is mitigated through diversification across numerous asset classes and... -
Page 218
... investments Payable upon return of securities loaned Net receivables (payables) Total plan assets December 31, 2010 Cash and cash equivalents Intermediate (core) fixed income (2) High-yield fixed income International fixed income Specialty fixed income Domestic large-cap stocks (3) Domestic mid-cap... -
Page 219
... investment companies are valued at the NAV of shares held at year end. Long Duration, Intermediate (Core), High-Yield, International and Specialty Fixed Income - includes investments traded on the secondary markets; prices are measured by using quoted market prices for similar securities, pricing... -
Page 220
... third parties in a sales transaction. Also includes investments in exchange-traded equity securities described above. Multi-Strategy Hedge Funds and Private Equity - the fair values of hedge funds are valued based on the proportionate share of the underlying net assets of the investment funds that... -
Page 221
... in investments Net operating loss and tax credit carry forwards Other Total deferred tax assets Deferred tax assets valuation allowance Deferred tax liabilities Mortgage servicing rights Leasing Mark to market, net Intangible assets Net unrealized gains on securities available for sale Other... -
Page 222
... written down investment, a decrease in tax expense associated with leveraged leases, as well as tax benefits related to charitable donations of appreciated securities. The change in unrecognized tax benefits follows: Year ended December 31, (in millions) Balance at beginning of year Additions: For... -
Page 223
... to purchase shares of common stock that were antidilutive (the exercise price was higher than the weighted-average market price), and therefore not included in the calculation of diluted earnings per common share. Weighted-average shares Year ended December 31, (in millions) Options Warrants 2011... -
Page 224
... of net gains on cash flow hedges included in net income Net unrealized gains (losses) arising during the year Defined benefit pension plans: Net actuarial gains (losses) Amortization of net actuarial loss and prior service cost included in net income Net gains (losses) arising during the year Other... -
Page 225
... equipment leases, real estate and other commercial financing, Small Business Administration financing, venture capital financing, cash management, payroll services, retirement plans, Health Savings Accounts, credit cards, and merchant payment processing. Community Banking also purchases sales... -
Page 226
... liabilities to fund its assets, a funding charge based on the cost of excess liabilities from another segment. (3) Represents segment net income (loss) for Community Banking; Wholesale Banking; and Wealth, Brokerage and Retirement segments and Wells Fargo net income for the consolidated company... -
Page 227
... reports under the Securities Exchange Act of 1934 and is no Condensed Consolidating Statement of Income Other consolidating WFFI subsidiaries Consolidated Company longer a separately rated company. The Parent also guaranteed all outstanding term debt securities of Wells Fargo Canada Corporation... -
Page 228
... Parent, WFFI, Other and Wells Fargo net income (loss) Year ended December 31, 2009 Dividends from subsidiaries: Bank Nonbank Interest income from loans Interest income from subsidiaries Other interest income Total interest income Deposits Short-term borrowings Long-term debt Other interest expense... -
Page 229
...from: Subsidiary banks Nonaffiliates Securities available for sale Mortgages and loans held for sale Loans Loans to subsidiaries: Bank Nonbank Allowance for loan losses Net loans Investments in subsidiaries: Bank Nonbank Other assets Total assets Liabilities and equity Deposits Short-term borrowings... -
Page 230
... collected on notes/loans made to subsidiaries Net decrease (increase) in investment in subsidiaries Net cash paid for acquisitions Other, net Net cash provided (used) by investing activities Cash flows from financing activities: Net change in: Deposits Short-term borrowings Long-term debt: Proceeds... -
Page 231
... benefits related to stock option payments Net change in noncontrolling interests: Purchase of Prudential's noncontrolling interest Other Other, net Net cash used by financing activities Net change in cash and due from banks Cash and due from banks at beginning of year Cash and due from banks at end... -
Page 232
... ratio consists of Tier 1 capital divided by quarterly average total assets, excluding goodwill and certain other items. The minimum leverage ratio guideline is 3% for banking organizations that do not anticipate significant growth and that have well-diversified risk, excellent asset quality, high... -
Page 233
... consolidated balance sheet of Wells Fargo & Company and Subsidiaries (the Company) as of December 31, 2011 and 2010, and the related consolidated statements of income, changes in equity and comprehensive income, and cash flows for each of the years in the three-year period ended December 31, 2011... -
Page 234
... for credit losses Noninterest income Service charges on deposit accounts Trust and investment fees Card fees Other fees Mortgage banking Insurance Net gains (losses) from trading activities Net gains (losses) on debt securities available for sale Net gains from equity investments Operating leases... -
Page 235
...Quarter ended December 31, 2011 Average balance Yields/ rates Interest income/ expense Average balance Yields/ rates 2010 Interest income/ expense (in millions) Earning assets Federal funds sold, securities purchased under resale agreements and other short-term investments Trading assets Securities... -
Page 236
... entity Globally systemic important bank Home Affordability Modification Program Home Price Index Department of Housing and Urban Development Loans held for sale London Interbank Offered Rate Lower of cost or market value Loan-to-value Mortgage-backed security SEC S&P SPE TARP TDR VA VaR VIE... -
Page 237
...(KBW) Total Return Bank Index (KBW Bank Index (BKX)) and the S&P 500 Index. The cumulative total stockholder returns (including reinvested dividends) in the graphs assume the investment of $100 in Wells Fargo's common stock, the KBW Bank Index and the S&P 500 Index. Five Year Performance Graph Ten... -
Page 238
Wells Fargo & Company Common stock Wells Fargo & Company is listed and trades on the New York Stock Exchange: WFC 5,262,611,636 common shares outstanding (12/31/11) Contacts Investor Relations 1âˆ'415âˆ'371âˆ'2121 [email protected] Shareholder Services and Transfer Agent Wells Fargo ... -
Page 239
...#2 Retail banking deposits 1 Total stores Retail mortgage lender Home loan originator to minority and low- to moderate-income consumers & in low- to moderate-income neighborhoods (2010 HMDA data) Used car lender (AutoCount 2011) Small business lender (U.S. in dollars per 2010 Community Reinvestment... -
Page 240
Wells Fargo & Company 420 Montgomery Street San Francisco, California 94104 1-866-878-5865 wellsfargo.com Our Vision: Satisfy all our customers' financial needs and help them succeed financially. Nuestra Vision: Deseamos satisfacer todas las necesidades financieras de nuestros clientes y ...