SunTrust 2010 Annual Report Download - page 99
Download and view the complete annual report
Please find page 99 of the 2010 SunTrust annual report below. You can navigate through the pages in the report by either clicking on the pages listed below, or by using the keyword search tool below to find specific information within the annual report.-
 1
1 -
2
-
3
-
4
-
5
-
6
-
7
-
8
-
9
-
10
-
11
-
12
-
13
-
14
-
15
-
16
-
17
-
18
-
19
-
20
-
21
-
22
-
23
-
24
-
25
-
26
-
27
-
28
-
29
-
30
-
31
-
32
-
33
-
34
-
35
-
36
-
37
-
38
-
39
-
40
-
41
-
42
-
43
-
44
-
45
-
46
-
47
-
48
-
49
-
50
-
51
-
52
-
53
-
54
-
55
-
56
-
57
-
58
-
59
-
60
-
61
-
62
-
63
-
64
-
65
-
66
-
67
-
68
-
69
-
70
-
71
-
72
-
73
-
74
-
75
-
76
-
77
-
78
-
79
-
80
-
81
-
82
-
83
-
84
-
85
-
86
-
87
-
88
-
 89
89 -
 90
90 -
 91
91 -
 92
92 -
 93
93 -
 94
94 -
 95
95 -
 96
96 -
 97
97 -
 98
98 -
 99
99 -
 100
100 -
 101
101 -
 102
102 -
 103
103 -
 104
104 -
 105
105 -
 106
106 -
 107
107 -
 108
108 -
 109
109 -
110
-
111
-
112
-
113
-
114
-
115
-
116
-
117
-
118
-
119
-
120
-
121
-
122
-
123
-
124
-
125
-
126
-
127
-
128
-
129
-
130
-
131
-
132
-
133
-
134
-
135
-
136
-
137
-
138
-
139
-
140
-
141
-
142
-
143
-
144
-
145
-
146
-
147
-
148
-
149
-
150
-
151
-
152
-
153
-
154
-
155
-
156
-
157
-
158
-
159
-
160
-
161
-
162
-
163
-
164
-
165
-
166
-
167
-
168
-
169
-
170
-
171
-
172
-
173
-
174
-
175
-
176
-
177
-
178
-
179
-
180
-
181
-
182
-
183
-
184
-
185
-
186
-
187
-
188
-
189
-
190
-
191
-
192
-
193
-
194
-
195
-
196
-
197
-
198
-
199
-
200
-
201
-
202
-
203
-
204
-
205
-
206
-
207
-
208
-
209
-
210
-
211
-
212
-
213
-
214
-
215
-
216
-
217
-
218
-
219
-
220
 |
 |

increased $41 million, or 27%, due to increased spreads. Higher line of credit utilization by large corporate clients
experienced early in the year declined as access to capital markets funding had improved. Total average customer deposits
increased $0.1 billion, or 2%, mainly due to increases in NOW accounts and demand deposits offset by a decrease in time
deposits. Customer deposit-related net interest income increased $7 million, or 10%, due to increased average balances
partially offset by a decrease in the relative value of demand deposits.
Provision for credit losses was $248 million, as net charge-offs increased $220 million from the prior year driven by a small
number of large corporate borrowers operating in economically sensitive industries.
Total noninterest income was $611 million, an increase of $149 million, or 32%. Capital markets-related income increased
$162 million, or 51%, primarily due to performance in equity derivatives, debt and equity originations, fixed income sales
and trading, and syndications. The strong performance in capital markets was partially offset by higher write-downs on
private equity investments and market volatility on hedges related to the corporate loan book.
Total noninterest expense was $481 million, an increase of $3 million, or 1%. The increase was primarily due to higher
operating losses, revenue based incentive compensation and pension expense. Offsetting these higher expenses were lower
salaries and other related staff expenses, as well as lower outside processing and miscellaneous expenses.
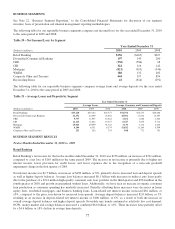
Mortgage
Mortgage reported a net loss of $995 million for the year ended December 31, 2009 compared with a net loss of $546 million
in 2008. The $449 million, or 82%, increase in the net loss was driven by higher credit-related costs and goodwill impairment
charges recorded in 2009 resulting from deterioration in residential real estate market conditions. Partially offsetting these
costs were higher production and servicing income.
Net interest income was $499 million, an increase of $3 million, or 1%, primarily due to higher interest income on LHFS and
deposits partially offset by lower consumer mortgage and investment related net interest income. LHFS increased $0.4
billion and contributed $72 million to the increase in net interest income due to improved funding costs resulting from lower
short-term rates. Consumer mortgage average balances declined $2.0 billion, or 7%, while the resulting net interest income
declined $56 million, or 17%, due to the decline in higher-margin second lien loans and lower spreads on prime first lien
mortgages. Total investments were down $3.5 billion, or 89% resulting in a decrease in net interest income of $43 million.
Average consumer and commercial deposits were up $0.9 billion and contributed $35 million to the change in net interest
income, principally due to higher average balances.
Provision for credit losses was $1.1 billion, an increase of $634 million, principally due to higher consumer mortgage charge-
offs.
Total noninterest income was $686 million, an increase of $250 million, or 57%, driven by higher mortgage production and
servicing income. Total mortgage production income increased $185 million, or 103%, principally due to income from
higher loan production volume at improved margins, partially offset by higher reserves for repurchased loans. Total
mortgage loan production for the year ended December 31, 2009 was $50.1 billion, up 38% from $36.4 billion the prior year.
Total servicing income increased $524 million primarily due to a $199 million recovery in 2009 on LOCOM MSRs
compared to a $370 million impairment charge in 2008. The 2008 MSR impairment was offset by net securities gains of
$411 million in the fourth quarter of 2008 from the sale of securities AFS that were held in conjunction with our risk
management strategies associated with economically hedging the value of MSRs. At December 31, 2009 total mortgage
loans serviced were $178.9 billion, up $16.9 billion, or 10% from $162.0 billion at December 31, 2008.
Total noninterest expense was $1.4 billion, an increase of $73 million, or 5%, primarily due to a $279 million non-cash
goodwill impairment charge recorded in the first quarter of 2009. Additionally, staff expense was up $112 million principally
due to higher commission expense resulting from higher loan production. Credit-related expense, including other real estate,
credit services, and collection costs, increased $106 million, or 61%. The increases were partially offset by a $347 million
decrease in operating losses primarily due to a change in classification related to borrower misrepresentation and claim
denials. Beginning in 2009, these losses were recorded as charge-offs against the allowance for loan losses and were included
in the overall allowance for loan losses. Additionally, mortgage insurance expense decreased $65 million as we reached the
limits of our exposure to reinsurance losses.
83