SunTrust 2010 Annual Report Download - page 42
Download and view the complete annual report
Please find page 42 of the 2010 SunTrust annual report below. You can navigate through the pages in the report by either clicking on the pages listed below, or by using the keyword search tool below to find specific information within the annual report.-
 1
1 -
2
-
3
-
4
-
5
-
6
-
7
-
8
-
9
-
10
-
11
-
12
-
13
-
14
-
15
-
16
-
17
-
18
-
19
-
20
-
21
-
22
-
23
-
24
-
25
-
26
-
27
-
28
-
29
-
30
-
31
-
 32
32 -
 33
33 -
 34
34 -
 35
35 -
 36
36 -
 37
37 -
 38
38 -
 39
39 -
 40
40 -
 41
41 -
 42
42 -
 43
43 -
 44
44 -
 45
45 -
 46
46 -
 47
47 -
 48
48 -
 49
49 -
 50
50 -
 51
51 -
 52
52 -
53
-
54
-
55
-
56
-
57
-
58
-
59
-
60
-
61
-
62
-
63
-
64
-
65
-
66
-
67
-
68
-
69
-
70
-
71
-
72
-
73
-
74
-
75
-
76
-
77
-
78
-
79
-
80
-
81
-
82
-
83
-
84
-
85
-
86
-
87
-
88
-
89
-
90
-
91
-
92
-
93
-
94
-
95
-
96
-
97
-
98
-
99
-
100
-
101
-
102
-
103
-
104
-
105
-
106
-
107
-
108
-
109
-
110
-
111
-
112
-
113
-
114
-
115
-
116
-
117
-
118
-
119
-
120
-
121
-
122
-
123
-
124
-
125
-
126
-
127
-
128
-
129
-
130
-
131
-
132
-
133
-
134
-
135
-
136
-
137
-
138
-
139
-
140
-
141
-
142
-
143
-
144
-
145
-
146
-
147
-
148
-
149
-
150
-
151
-
152
-
153
-
154
-
155
-
156
-
157
-
158
-
159
-
160
-
161
-
162
-
163
-
164
-
165
-
166
-
167
-
168
-
169
-
170
-
171
-
172
-
173
-
174
-
175
-
176
-
177
-
178
-
179
-
180
-
181
-
182
-
183
-
184
-
185
-
186
-
187
-
188
-
189
-
190
-
191
-
192
-
193
-
194
-
195
-
196
-
197
-
198
-
199
-
200
-
201
-
202
-
203
-
204
-
205
-
206
-
207
-
208
-
209
-
210
-
211
-
212
-
213
-
214
-
215
-
216
-
217
-
218
-
219
-
220
 |
 |
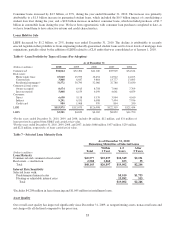
During the year, average loans declined 6% compared to the 2009 average loan balance, with the majority of the decline due
to a reduction in our exposure to real estate-related assets and commercial loans, as well as due to weak loan demand during
the year. While the total average balances have declined, our risk profile during the year has also improved as much of the
decline has been in higher-risk loans while growth in certain portfolios included the addition of lower-risk loans that have
attractive return and credit characteristics including an increase in government guaranteed loans. Despite recent soft loan
demand we remain focused on extending credit to qualified borrowers as businesses and consumers work through the
economic downturn. During 2010, we extended approximately $74.3 billion in new loan originations, commitments, and
renewals of commercial and consumer loans to our clients.
Consumer and commercial deposits increased during the year and a positive shift in mix to lower cost deposits was prevalent
as average balance increases were driven by lower cost noninterest-bearing and money market accounts, which increased
from 2009 by 8% and 22%, respectively, providing $8.9 billion in combined average growth. Partially offsetting this growth
was the decline in higher cost CD balances, which decreased an average of $6.3 billion during 2010. Due to the growth seen
during 2010 in core deposits, our liquidity was enhanced. Additionally, this increase in low cost deposits has enabled us to
reduce our higher-cost funding sources, helping to drive significant reductions in our funding costs and improvement in net
interest margin. While we believe that a portion of the low-cost deposit growth is attributable to clients holding higher levels
of liquidity, we also believe that the growth is a direct result of investments that we have made to enhance our clients’
banking experience and to drive household market share growth.
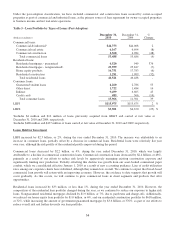
Our client-focused revenue generation strategies, lower cost funding mix, improved asset quality, and continued expense
management discipline contributed to improved operating trends as seen in higher net interest margin, higher core fee
income, and controlled operating expenses. Total revenue, on an FTE basis, increased 5% compared to the prior year due to
increased earning assets, stable fee based revenue, particularly investment banking revenue, and expanded net interest
margin. Net interest income, on an FTE basis, increased 8%, compared to 2009. The increase in net interest income is due to
lower funding costs, improved funding mix, and a reduction in long-term debt. As a result, our net interest margin increased
to 3.38% for the year ended December 31, 2010 from 3.04% in 2009. Noninterest income remained stable during 2010, most
notably due to increases in trading income offset by lower mortgage production income and lower service charges on deposit
accounts. Noninterest expense decreased 10% compared to 2009, driven primarily by a noncash goodwill impairment charge
taken during 2009. When excluding that impairment charge, noninterest expense increased 2% in 2010 when compared to
2009. This increase was driven by increases in outside processing and software, marketing expenses, and compensation, as
we sought to balance investments in our business with expense discipline. Consistent with our focus to invest in our people
and grow the business, the increases in these categories related specifically to hiring in technology, mortgage, and client
support areas, investing in client acquisition and risk management technology, and more broadly related to higher transaction
volumes and additional investments focused on growth of our business. Partially offsetting these increases were declines in
credit-related costs of $28 million. We also experienced higher losses on debt extinguishment compared to 2009 as we
proactively reduced our dependency on higher cost funding as a result of excess liquidity. See additional discussion of our
financial performance in the “Consolidated Financial Results” section of this MD&A.
26