SunTrust 2010 Annual Report Download - page 127
Download and view the complete annual report
Please find page 127 of the 2010 SunTrust annual report below. You can navigate through the pages in the report by either clicking on the pages listed below, or by using the keyword search tool below to find specific information within the annual report.-
 1
1 -
2
-
3
-
4
-
5
-
6
-
7
-
8
-
9
-
10
-
11
-
12
-
13
-
14
-
15
-
16
-
17
-
18
-
19
-
20
-
21
-
22
-
23
-
24
-
25
-
26
-
27
-
28
-
29
-
30
-
31
-
32
-
33
-
34
-
35
-
36
-
37
-
38
-
39
-
40
-
41
-
42
-
43
-
44
-
45
-
46
-
47
-
48
-
49
-
50
-
51
-
52
-
53
-
54
-
55
-
56
-
57
-
58
-
59
-
60
-
61
-
62
-
63
-
64
-
65
-
66
-
67
-
68
-
69
-
70
-
71
-
72
-
73
-
74
-
75
-
76
-
77
-
78
-
79
-
80
-
81
-
82
-
83
-
84
-
85
-
86
-
87
-
88
-
89
-
90
-
91
-
92
-
93
-
94
-
95
-
96
-
97
-
98
-
99
-
100
-
101
-
102
-
103
-
104
-
105
-
106
-
107
-
108
-
109
-
110
-
111
-
112
-
113
-
114
-
115
-
116
-
 117
117 -
 118
118 -
 119
119 -
 120
120 -
 121
121 -
 122
122 -
 123
123 -
 124
124 -
 125
125 -
 126
126 -
 127
127 -
 128
128 -
 129
129 -
 130
130 -
 131
131 -
 132
132 -
 133
133 -
 134
134 -
 135
135 -
 136
136 -
 137
137 -
138
-
139
-
140
-
141
-
142
-
143
-
144
-
145
-
146
-
147
-
148
-
149
-
150
-
151
-
152
-
153
-
154
-
155
-
156
-
157
-
158
-
159
-
160
-
161
-
162
-
163
-
164
-
165
-
166
-
167
-
168
-
169
-
170
-
171
-
172
-
173
-
174
-
175
-
176
-
177
-
178
-
179
-
180
-
181
-
182
-
183
-
184
-
185
-
186
-
187
-
188
-
189
-
190
-
191
-
192
-
193
-
194
-
195
-
196
-
197
-
198
-
199
-
200
-
201
-
202
-
203
-
204
-
205
-
206
-
207
-
208
-
209
-
210
-
211
-
212
-
213
-
214
-
215
-
216
-
217
-
218
-
219
-
220
 |
 |

SUNTRUST BANKS, INC.
Notes to Consolidated Financial Statements (Continued)
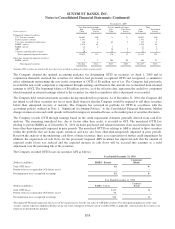
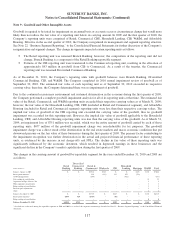
indicator. The Company assigns credit ratings to commercial borrowers in a manner generally consistent with NRSRO
guidelines, except that the Company’s credit ratings also consider proprietary loss severity expectations in addition to
borrower creditworthiness to derive a dual rating approach to risk of loss. An independent credit rating agency will rate a
borrower with an elevated risk of default as noninvestment grade. There will be instances, however, where the Company
rates the risk of loss for a loan to this type of borrower as investment grade due to a lower expected loss severity, which is
influenced by collateral and other structural factors. Ratings are updated at least annually or more frequently if there is a
material change in creditworthiness. For consumer and residential loans, the Company believes that consumer credit risk, as
assessed by the FICO scoring method, is a relevant credit quality indicator. FICO scores are obtained at origination as part of
the Company’s formal underwriting process, and refreshed FICO scores are obtained by the Company at least quarterly.
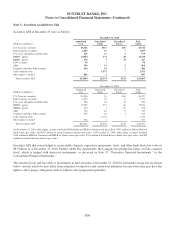
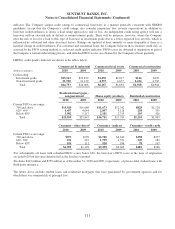
LHFI by credit quality indicator are shown in the tables below:
Commercial & industrial Commercial real estate Commercial construction
(Dollars in millions) 2010 2009 2010 2009 2010 2009
Credit rating:
Investment grade $23,163 $22,879 $1,230 $2,017 $144 $199
Non-investment grade 21,590 21,129 4,937 4,677 2,424 4,785
Total $44,753 $44,008 $6,167 $6,694 $2,568 $4,984
Residential mortgages -
nonguaranteed Home equity products Residential construction
2010 2009 2010 2009 2010 2009
Current FICO score range:
700 and above $15,920 $16,086 $11,673 $12,342 $828 $1,128
620 - 699 4,457 4,644 2,897 3,128 258 355
Below 62013,582 5,117 2,181 2,313 205 426
Total $23,959 $25,847 $16,751 $17,783 $1,291 $1,909
Consumer - other direct2Consumer - indirect Consumer - credit cards
2010 2009 2010 2009 2010 2009
Current FICO score range:
700 and above $973 $799 $6,780 $4,160 $258 $277
620 - 699 231 219 1,799 1,551 149 182
Below 6201105 111 920 954 78 107
Total $1,309 $1,129 $9,499 $6,665 $485 $566
1For substantially all loans with refreshed FICO scores below 620, the borrower’s FICO score at the time of origination
exceeded 620 but has since deteriorated as the loan has seasoned.
2Excludes $413 million and $355 million as of December 31, 2010 and 2009, respectively, of private-label student loans with
third-party insurance.
The tables above exclude student loans and residential mortgages that were guaranteed by government agencies and for
which there was nominal risk of principal loss.
111