SunTrust 2010 Annual Report Download - page 159
Download and view the complete annual report
Please find page 159 of the 2010 SunTrust annual report below. You can navigate through the pages in the report by either clicking on the pages listed below, or by using the keyword search tool below to find specific information within the annual report.-
 1
1 -
2
-
3
-
4
-
5
-
6
-
7
-
8
-
9
-
10
-
11
-
12
-
13
-
14
-
15
-
16
-
17
-
18
-
19
-
20
-
21
-
22
-
23
-
24
-
25
-
26
-
27
-
28
-
29
-
30
-
31
-
32
-
33
-
34
-
35
-
36
-
37
-
38
-
39
-
40
-
41
-
42
-
43
-
44
-
45
-
46
-
47
-
48
-
49
-
50
-
51
-
52
-
53
-
54
-
55
-
56
-
57
-
58
-
59
-
60
-
61
-
62
-
63
-
64
-
65
-
66
-
67
-
68
-
69
-
70
-
71
-
72
-
73
-
74
-
75
-
76
-
77
-
78
-
79
-
80
-
81
-
82
-
83
-
84
-
85
-
86
-
87
-
88
-
89
-
90
-
91
-
92
-
93
-
94
-
95
-
96
-
97
-
98
-
99
-
100
-
101
-
102
-
103
-
104
-
105
-
106
-
107
-
108
-
109
-
110
-
111
-
112
-
113
-
114
-
115
-
116
-
117
-
118
-
119
-
120
-
121
-
122
-
123
-
124
-
125
-
126
-
127
-
128
-
129
-
130
-
131
-
132
-
133
-
134
-
135
-
136
-
137
-
138
-
139
-
140
-
141
-
142
-
143
-
144
-
145
-
146
-
147
-
148
-
 149
149 -
 150
150 -
 151
151 -
 152
152 -
 153
153 -
 154
154 -
 155
155 -
 156
156 -
 157
157 -
 158
158 -
 159
159 -
 160
160 -
 161
161 -
 162
162 -
 163
163 -
 164
164 -
 165
165 -
 166
166 -
 167
167 -
 168
168 -
 169
169 -
170
-
171
-
172
-
173
-
174
-
175
-
176
-
177
-
178
-
179
-
180
-
181
-
182
-
183
-
184
-
185
-
186
-
187
-
188
-
189
-
190
-
191
-
192
-
193
-
194
-
195
-
196
-
197
-
198
-
199
-
200
-
201
-
202
-
203
-
204
-
205
-
206
-
207
-
208
-
209
-
210
-
211
-
212
-
213
-
214
-
215
-
216
-
217
-
218
-
219
-
220
 |
 |

SUNTRUST BANKS, INC.
Notes to Consolidated Financial Statements (Continued)
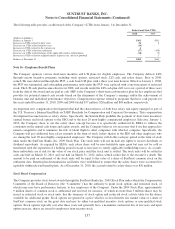
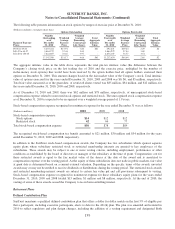
Limited visible market activity exists for these instruments or similar instruments and therefore significant unobservable
assumptions are used to value the securities. In 2009, private placements were classified as level 3 assets; however, at the end
of 2010, these were transferred to level 2 assets due to improved market conditions.
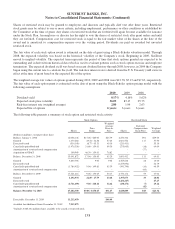
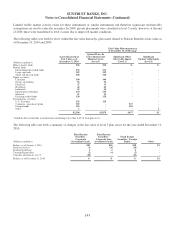
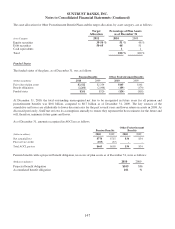
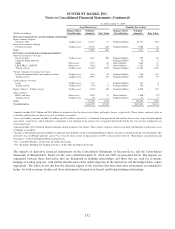
The following tables sets forth by level, within the fair value hierarchy, plan assets related to Pension Benefits at fair value as
of December 31, 2010 and 2009:
(Dollars in millions)
Assets Measured at
Fair Value as of
December 31, 2010
Fair Value Measurements as
of December 31, 2010 using 1
Quoted Prices In
Active Markets for
Identical Assets
(Level 1)
Significant Other
Observable Inputs
(Level 2)
Significant
Unobservable Inputs
(Level 3)
Money market funds $36 $36 $- $-
Mutual funds:
International diversified funds 376 376 - -
Large cap funds 292 292 - -
Small and mid cap funds 248 248 - -
Equity securities:
Consumer 108 108 - -
Energy and utilities 56 56 - -
Financials 35 35 - -
Healthcare 42 42 - -
Industrials 69 69 - -
Information technology 130 130 - -
Materials 21 21 - -
Exchange traded funds 128 128 - -
Fixed income securities:
U.S. Treasuries 329 329 - -
Corporate - investment grade 519 - 519 -
Foreign bonds 118 - 118 -
Other 1--1
$2,508 $1,870 $637 $1
1Schedule does not include accrued income amounting to less than 0.6% of total plan assets.
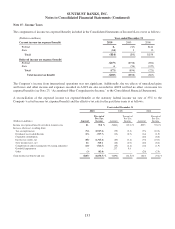
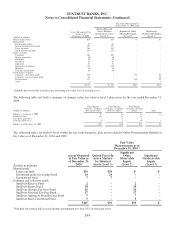
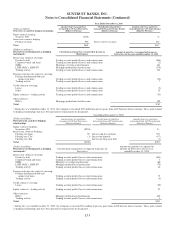
The following table sets forth a summary of changes in the fair value of level 3 plan assets for the year ended December 31,
2010:
(Dollars in millions)
Fixed Income
Securities -
Corporate
Investment Grade
Fixed Income
Securities -
Corporate Non-
investment Grade
Fixed Income
Securities - Foreign
Bonds Other
Balance as of January 1, 2010 $82 $26 $38 $1
Purchases/(sales) (1) (26) (18) -
Realized gain/(loss) 64 4 -
Unrealized gain/(loss) (2) (4) (2) -
Transfers into/(out of) level 3 (85) - (22) -
Balance as of December 31, 2010 $- $- $- $1
143