SunTrust 2010 Annual Report Download - page 148
Download and view the complete annual report
Please find page 148 of the 2010 SunTrust annual report below. You can navigate through the pages in the report by either clicking on the pages listed below, or by using the keyword search tool below to find specific information within the annual report.-
 1
1 -
2
-
3
-
4
-
5
-
6
-
7
-
8
-
9
-
10
-
11
-
12
-
13
-
14
-
15
-
16
-
17
-
18
-
19
-
20
-
21
-
22
-
23
-
24
-
25
-
26
-
27
-
28
-
29
-
30
-
31
-
32
-
33
-
34
-
35
-
36
-
37
-
38
-
39
-
40
-
41
-
42
-
43
-
44
-
45
-
46
-
47
-
48
-
49
-
50
-
51
-
52
-
53
-
54
-
55
-
56
-
57
-
58
-
59
-
60
-
61
-
62
-
63
-
64
-
65
-
66
-
67
-
68
-
69
-
70
-
71
-
72
-
73
-
74
-
75
-
76
-
77
-
78
-
79
-
80
-
81
-
82
-
83
-
84
-
85
-
86
-
87
-
88
-
89
-
90
-
91
-
92
-
93
-
94
-
95
-
96
-
97
-
98
-
99
-
100
-
101
-
102
-
103
-
104
-
105
-
106
-
107
-
108
-
109
-
110
-
111
-
112
-
113
-
114
-
115
-
116
-
117
-
118
-
119
-
120
-
121
-
122
-
123
-
124
-
125
-
126
-
127
-
128
-
129
-
130
-
131
-
132
-
133
-
134
-
135
-
136
-
137
-
 138
138 -
 139
139 -
 140
140 -
 141
141 -
 142
142 -
 143
143 -
 144
144 -
 145
145 -
 146
146 -
 147
147 -
 148
148 -
 149
149 -
 150
150 -
 151
151 -
 152
152 -
 153
153 -
 154
154 -
 155
155 -
 156
156 -
 157
157 -
 158
158 -
159
-
160
-
161
-
162
-
163
-
164
-
165
-
166
-
167
-
168
-
169
-
170
-
171
-
172
-
173
-
174
-
175
-
176
-
177
-
178
-
179
-
180
-
181
-
182
-
183
-
184
-
185
-
186
-
187
-
188
-
189
-
190
-
191
-
192
-
193
-
194
-
195
-
196
-
197
-
198
-
199
-
200
-
201
-
202
-
203
-
204
-
205
-
206
-
207
-
208
-
209
-
210
-
211
-
212
-
213
-
214
-
215
-
216
-
217
-
218
-
219
-
220
 |
 |

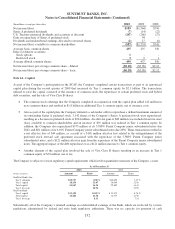
SUNTRUST BANKS, INC.
Notes to Consolidated Financial Statements (Continued)
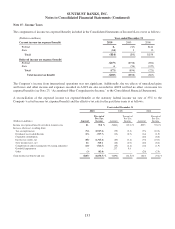
(In millions, except per share data) 2010 2009 2008
Net income/(loss) $189 ($1,564) $796
Series A preferred dividends (7) (14) (22)
U.S. Treasury preferred dividends and accretion of discount (267) (266) (27)
Gain on repurchase of Series A preferred stock -94 -
Dividends and undistributed earnings allocated to unvested shares (2) 17 (6)
Net income/(loss) available to common shareholders ($87) ($1,733) $741
Average basic common shares 495 435 349
Effect of dilutive securities:
Stock options 1--
Restricted stock 321
Average diluted common shares 499 437 350
Net income/(loss) per average common share – diluted ($0.18) ($3.98) $2.12
Net income/(loss) per average common share – basic ($0.18) ($3.98) $2.12
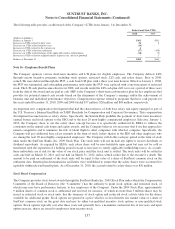
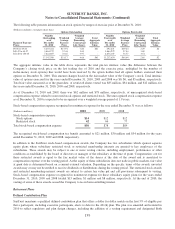
Note 14 - Capital
As part of the Company’s participation in the SCAP, the Company completed certain transactions as part of an announced
capital plan during the second quarter of 2009 that increased its Tier 1 common equity by $2.1 billion. The transactions
utilized to raise the capital consisted of the issuance of common stock, the repurchase of certain preferred stock and hybrid
debt securities, and the sale of Visa Class B shares.
•The common stock offerings that the Company completed in conjunction with the capital plan added 142 million in
new common shares and resulted in $1.8 billion in additional Tier 1 common equity, net of issuance costs.
•Also as part of the capital plan, the Company initiated a cash tender offer to repurchase a defined maximum amount of
its outstanding Series A preferred stock. 3,142 shares of the Company’s Series A preferred stock were repurchased,
resulting in a decrease in preferred stock of $314 million. An after-tax gain of $89 million was included in net income/
(loss) available to common shareholders and an increase of $91 million was realized in Tier 1 common equity. In
addition, the Company also repurchased $375 million of its 5.588% Parent Company junior subordinated notes due
2042, and $61 million of its 6.10% Parent Company junior subordinated notes due 2036. These transactions resulted in
a net after-tax loss of $44 million, as a result of a $165 million after-tax loss related to the extinguishment of the
preferred stock forward sale agreement associated with the repurchase of the 5.588% Parent Company junior
subordinated notes, and a $121 million after-tax gain from the repurchase of the Parent Company junior subordinated
notes. The aggregate impact of the debt repurchases was a $121 million increase to Tier 1 common equity.
•Another element of the capital plan involved the sale of Visa Class B shares resulting in an increase in Tier 1
common equity of $70 million, net of tax.
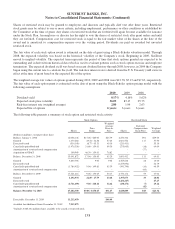
The Company is subject to various regulatory capital requirements which involve quantitative measures of the Company’s assets.
As of December 31
2010 2009
(Dollars in millions) Amount Ratio Amount Ratio
SunTrust Banks, Inc.
Tier 1 common $10,737 8.08 % $10,692 7.67 %
Tier 1 capital 18,156 13.67 18,069 12.96
Total capital 21,967 16.54 22,895 16.43
Tier 1 leverage 10.94 10.90
SunTrust Bank
Tier 1 capital $13,120 10.05 % $ 11,973 8.76 %
Total capital 16,424 12.58 16,377 11.98
Tier 1 leverage 8.33 7.51
Substantially all of the Company’s retained earnings are undistributed earnings of the Bank, which are restricted by various
regulations administered by federal and state bank regulatory authorities. There was no capacity for payment of cash
132