SunTrust 2010 Annual Report Download - page 51
Download and view the complete annual report
Please find page 51 of the 2010 SunTrust annual report below. You can navigate through the pages in the report by either clicking on the pages listed below, or by using the keyword search tool below to find specific information within the annual report.-
 1
1 -
2
-
3
-
4
-
5
-
6
-
7
-
8
-
9
-
10
-
11
-
12
-
13
-
14
-
15
-
16
-
17
-
18
-
19
-
20
-
21
-
22
-
23
-
24
-
25
-
26
-
27
-
28
-
29
-
30
-
31
-
32
-
33
-
34
-
35
-
36
-
37
-
38
-
39
-
40
-
 41
41 -
 42
42 -
 43
43 -
 44
44 -
 45
45 -
 46
46 -
 47
47 -
 48
48 -
 49
49 -
 50
50 -
 51
51 -
 52
52 -
 53
53 -
 54
54 -
 55
55 -
 56
56 -
 57
57 -
 58
58 -
 59
59 -
 60
60 -
 61
61 -
62
-
63
-
64
-
65
-
66
-
67
-
68
-
69
-
70
-
71
-
72
-
73
-
74
-
75
-
76
-
77
-
78
-
79
-
80
-
81
-
82
-
83
-
84
-
85
-
86
-
87
-
88
-
89
-
90
-
91
-
92
-
93
-
94
-
95
-
96
-
97
-
98
-
99
-
100
-
101
-
102
-
103
-
104
-
105
-
106
-
107
-
108
-
109
-
110
-
111
-
112
-
113
-
114
-
115
-
116
-
117
-
118
-
119
-
120
-
121
-
122
-
123
-
124
-
125
-
126
-
127
-
128
-
129
-
130
-
131
-
132
-
133
-
134
-
135
-
136
-
137
-
138
-
139
-
140
-
141
-
142
-
143
-
144
-
145
-
146
-
147
-
148
-
149
-
150
-
151
-
152
-
153
-
154
-
155
-
156
-
157
-
158
-
159
-
160
-
161
-
162
-
163
-
164
-
165
-
166
-
167
-
168
-
169
-
170
-
171
-
172
-
173
-
174
-
175
-
176
-
177
-
178
-
179
-
180
-
181
-
182
-
183
-
184
-
185
-
186
-
187
-
188
-
189
-
190
-
191
-
192
-
193
-
194
-
195
-
196
-
197
-
198
-
199
-
200
-
201
-
202
-
203
-
204
-
205
-
206
-
207
-
208
-
209
-
210
-
211
-
212
-
213
-
214
-
215
-
216
-
217
-
218
-
219
-
220
 |
 |

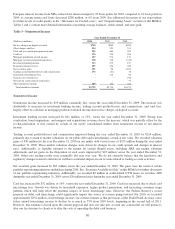
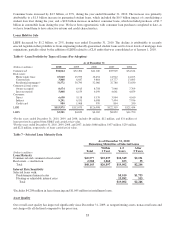
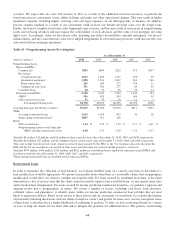
Consumer loans increased by $4.5 billion, or 39%, during the year ended December 31, 2010. The increase was primarily
attributable to a $1.5 billion increase in guaranteed student loans, which included the $0.5 billion impact of consolidating a
student loan trust during the year, and a $2.8 billion increase in indirect consumer loans, which included purchases of $1.7
billion in automobile loans during the year. We have been opportunistic with consumer loan purchases completed to date, as
we have found them to have attractive returns and credit characteristics.
Loans Held for Sale
LHFS decreased by $1.2 billion, or 25%, during year ended December 31, 2010. The decline is attributable to recently
enacted legislation that prohibits us from originating federally-guaranteed student loans and to lower levels of mortgage loan
originations, partially offset by the addition of LHFS related to a CLO entity that was consolidated as of January 1, 2010.
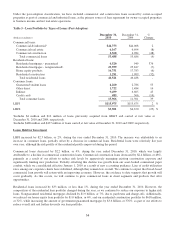
Table 6 - Loan Portfolio by Types of Loans (Pre-Adoption)
As of December 31
(Dollars in millions) 2010 2009 2008 2007 2006
Commercial1$34,064 $32,494 $41,040 $35,929 $34,614
Real estate:
Home equity lines 15,040 15,953 16,454 14,912 14,103
Construction 3,848 6,647 9,864 13,777 13,893
Residential mortgages231,572 30,790 32,066 32,780 33,830
Commercial real estate:
Owner occupied 8,674 8,915 8,758 7,948 7,709
Investor owned 5,868 6,159 6,199 4,661 4,859
Consumer:
Direct 6,638 5,118 5,139 3,964 4,160
Indirect 9,291 6,531 6,508 7,494 7,936
Credit card 980 1,068 970 854 350
LHFI $115,975 $113,675 $126,998 $122,319 $121,454
LHFS $3,501 $4,670 $4,032 $8,852 $11,790
1For the years ended December 31, 2010, 2009, and 2008, includes $4 million, $12 million, and $31 million of
loans previously acquired from GB&T and carried at fair value.
2For the years ended December 31, 2010, 2009, 2008, and 2007, includes $488 million, $437 million, $239 million,
and $221 million, respectively, of loans carried at fair value.
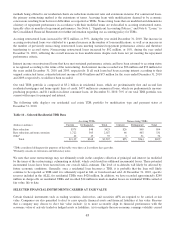
Table 7 – Selected Loan Maturity Data
As of December 31, 2010
Remaining Maturities of Selected Loans
Total
Within
1 Year
1-5
Years
After
5 Years
(Dollars in millions)
Loan Maturity
Commercial and commercial real estate1$45,577 $25,037 $18,349 $2,191
Real estate - construction 2,568 1,860 653 55
Total $48,145 $26,897 $19,002 $2,246
Interest Rate Sensitivity
Selected loans with:
Predetermined interest rates $5,010 $1,733
Floating or adjustable interest rates 13,992 513
Total $19,002 $2,246
1Excludes $4,298 million in lease financing and $1,045 million in installment loans.
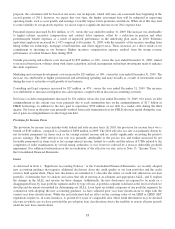
Asset Quality
Our overall asset quality has improved significantly since December 31, 2009, as nonperforming assets, nonaccrual loans and
net charge-offs all declined compared to the prior year.
35