SunTrust 2010 Annual Report Download - page 152
Download and view the complete annual report
Please find page 152 of the 2010 SunTrust annual report below. You can navigate through the pages in the report by either clicking on the pages listed below, or by using the keyword search tool below to find specific information within the annual report.-
 1
1 -
2
-
3
-
4
-
5
-
6
-
7
-
8
-
9
-
10
-
11
-
12
-
13
-
14
-
15
-
16
-
17
-
18
-
19
-
20
-
21
-
22
-
23
-
24
-
25
-
26
-
27
-
28
-
29
-
30
-
31
-
32
-
33
-
34
-
35
-
36
-
37
-
38
-
39
-
40
-
41
-
42
-
43
-
44
-
45
-
46
-
47
-
48
-
49
-
50
-
51
-
52
-
53
-
54
-
55
-
56
-
57
-
58
-
59
-
60
-
61
-
62
-
63
-
64
-
65
-
66
-
67
-
68
-
69
-
70
-
71
-
72
-
73
-
74
-
75
-
76
-
77
-
78
-
79
-
80
-
81
-
82
-
83
-
84
-
85
-
86
-
87
-
88
-
89
-
90
-
91
-
92
-
93
-
94
-
95
-
96
-
97
-
98
-
99
-
100
-
101
-
102
-
103
-
104
-
105
-
106
-
107
-
108
-
109
-
110
-
111
-
112
-
113
-
114
-
115
-
116
-
117
-
118
-
119
-
120
-
121
-
122
-
123
-
124
-
125
-
126
-
127
-
128
-
129
-
130
-
131
-
132
-
133
-
134
-
135
-
136
-
137
-
138
-
139
-
140
-
141
-
 142
142 -
 143
143 -
 144
144 -
 145
145 -
 146
146 -
 147
147 -
 148
148 -
 149
149 -
 150
150 -
 151
151 -
 152
152 -
 153
153 -
 154
154 -
 155
155 -
 156
156 -
 157
157 -
 158
158 -
 159
159 -
 160
160 -
 161
161 -
 162
162 -
163
-
164
-
165
-
166
-
167
-
168
-
169
-
170
-
171
-
172
-
173
-
174
-
175
-
176
-
177
-
178
-
179
-
180
-
181
-
182
-
183
-
184
-
185
-
186
-
187
-
188
-
189
-
190
-
191
-
192
-
193
-
194
-
195
-
196
-
197
-
198
-
199
-
200
-
201
-
202
-
203
-
204
-
205
-
206
-
207
-
208
-
209
-
210
-
211
-
212
-
213
-
214
-
215
-
216
-
217
-
218
-
219
-
220
 |
 |

SUNTRUST BANKS, INC.
Notes to Consolidated Financial Statements (Continued)
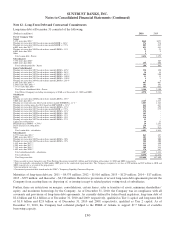
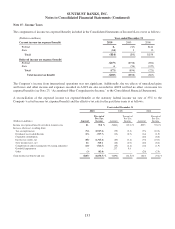
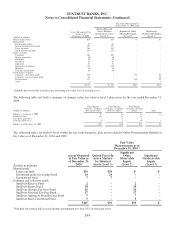
Deferred income tax liabilities and assets result from temporary differences between assets and liabilities measured for financial
reporting purposes and for income tax return purposes. These assets and liabilities are measured using the enacted tax rates and
laws that are currently in effect. Deferred income tax liabilities and assets are recorded net in other liabilities in the Consolidated
Balance Sheets. The significant components of the net deferred tax asset and liability at December 31 were as follows:
December 31
(Dollars in millions) 2010 2009
Deferred Tax Assets
Allowance for loan losses $1,092 $1,181
Accrued expenses 378 402
Other real estate owned 97 62
Loans 102 57
State net operating losses and other carryforwards (net of federal benefit) 132 115
Federal net operating loss and other carryforwards 280 522
Securities 33 14
Other 152 146
Gross deferred tax asset $2,266 $2,499
Deferred Tax Liabilities
Net unrealized gains in AOCI $915 $590
Leasing 701 720
Employee benefits 88 139
MSRs 610 496
Mark to market 269 320
Intangible assets 97 50
Fixed assets 155 86
Other 80 96
Gross deferred tax liability 2,915 2,497
Net deferred tax asset/(liability) ($649) $2
The deferred tax assets include a federal NOL and other federal carryforwards of $280 million and $522 million as of
December 31, 2010 and 2009, respectively. The decrease was primarily attributable to the carryback of the 2009 federal
NOL. No valuation allowance is necessary on the federal deferred tax assets. The federal NOL and the majority of the federal
carryforwards will expire, if not utilized, by 2030. The deferred tax assets include state NOL and other state carryforwards of
$132 million (net of a valuation allowance of $50 million) for 2010 and $115 million (net of a valuation allowance of $44
million) for 2009. The state carryforwards expire, if not utilized, in varying amounts from 2011 to 2030.
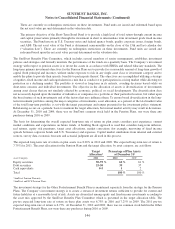
As of December 31, 2010, the Company’s gross cumulative UTBs amounted to $102 million, of which $69 million (net of
federal tax benefit) would affect the Company’s effective tax rate, if recognized. As of December 31, 2009, the Company’s
gross cumulative UTBs amounted to $161 million. The reduction in UTBs was primarily attributable to the settlement of
examinations by certain taxing authorities and the related payments and reversal of the liability. Additionally, the Company
has a gross liability of $21 million and $39 million for interest related to its UTBs as of December 31, 2010 and 2009,
respectively. Interest recognized related to UTBs was income of $10 million and $18 million for the years ended
December 31, 2010 and 2009, respectively. The Company continually evaluates the UTBs associated with its uncertain tax
positions. The Company does not have any positions for which it is reasonably possible that the total amount of UTBs will
significantly increase or decrease during the next 12 months.
The Company files consolidated and separate income tax returns in the U.S. federal jurisdiction and in various state
jurisdictions. As of December 31, 2010, the Company’s federal returns through 2006 have been examined by the IRS. All
issues have been resolved for tax years through 2004 and only one issue remains in dispute for tax years 2005 and 2006. The
Company’s 2007 through 2009 federal income tax returns are currently under examination by the IRS. Generally, the state
jurisdictions in which the Company files income tax returns are subject to examination for a period from three to seven years
after returns are filed.
136