SunTrust 2010 Annual Report Download - page 169
Download and view the complete annual report
Please find page 169 of the 2010 SunTrust annual report below. You can navigate through the pages in the report by either clicking on the pages listed below, or by using the keyword search tool below to find specific information within the annual report.-
 1
1 -
2
-
3
-
4
-
5
-
6
-
7
-
8
-
9
-
10
-
11
-
12
-
13
-
14
-
15
-
16
-
17
-
18
-
19
-
20
-
21
-
22
-
23
-
24
-
25
-
26
-
27
-
28
-
29
-
30
-
31
-
32
-
33
-
34
-
35
-
36
-
37
-
38
-
39
-
40
-
41
-
42
-
43
-
44
-
45
-
46
-
47
-
48
-
49
-
50
-
51
-
52
-
53
-
54
-
55
-
56
-
57
-
58
-
59
-
60
-
61
-
62
-
63
-
64
-
65
-
66
-
67
-
68
-
69
-
70
-
71
-
72
-
73
-
74
-
75
-
76
-
77
-
78
-
79
-
80
-
81
-
82
-
83
-
84
-
85
-
86
-
87
-
88
-
89
-
90
-
91
-
92
-
93
-
94
-
95
-
96
-
97
-
98
-
99
-
100
-
101
-
102
-
103
-
104
-
105
-
106
-
107
-
108
-
109
-
110
-
111
-
112
-
113
-
114
-
115
-
116
-
117
-
118
-
119
-
120
-
121
-
122
-
123
-
124
-
125
-
126
-
127
-
128
-
129
-
130
-
131
-
132
-
133
-
134
-
135
-
136
-
137
-
138
-
139
-
140
-
141
-
142
-
143
-
144
-
145
-
146
-
147
-
148
-
149
-
150
-
151
-
152
-
153
-
154
-
155
-
156
-
157
-
158
-
 159
159 -
 160
160 -
 161
161 -
 162
162 -
 163
163 -
 164
164 -
 165
165 -
 166
166 -
 167
167 -
 168
168 -
 169
169 -
 170
170 -
 171
171 -
 172
172 -
 173
173 -
 174
174 -
 175
175 -
 176
176 -
 177
177 -
 178
178 -
 179
179 -
180
-
181
-
182
-
183
-
184
-
185
-
186
-
187
-
188
-
189
-
190
-
191
-
192
-
193
-
194
-
195
-
196
-
197
-
198
-
199
-
200
-
201
-
202
-
203
-
204
-
205
-
206
-
207
-
208
-
209
-
210
-
211
-
212
-
213
-
214
-
215
-
216
-
217
-
218
-
219
-
220
 |
 |

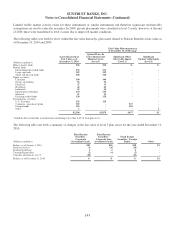
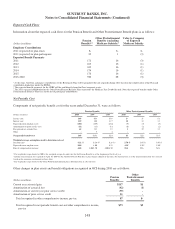
SUNTRUST BANKS, INC.
Notes to Consolidated Financial Statements (Continued)
Year Ended December 31, 2010
(Dollars in millions)
Derivatives in cash flow hedging relationships
Amount of pre-tax gain/(loss)
recognized in OCI on Derivatives
(Effective Portion)
Classification of gain/(loss)
reclassified from AOCI into Income
(Effective Portion)
Amount of pre-tax gain/(loss)
reclassified from AOCI into Income
(Effective Portion) 1
Equity contracts hedging:
Securities AFS ($101) $-
Interest rate contracts hedging:
Floating rate loans 903 Interest and fees on loans 487
Total $802 $487
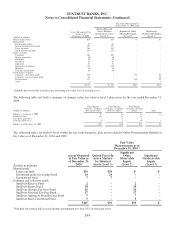
(Dollars in millions)
Derivatives not designated as hedging
instruments
Classification of gain/(loss) recognized in Income on
Derivatives Amount of gain/(loss) recognized in Income on
Derivatives for the year ended December 31, 2010
Interest rate contracts covering:
Fixed rate debt Trading account profits/(losses) and commissions ($64)
Corporate bonds and loans Trading account profits/(losses) and commissions (1)
MSRs Mortgage servicing related income 444
LHFS, IRLCs, LHFI-FV Mortgage production related income (176)
Trading activity Trading account profits/(losses) and commissions 304
Foreign exchange rate contracts covering:
Foreign-denominated debt and
commercial loans Trading account profits/(losses) and commissions (94)
Trading activity Trading account profits/(losses) and commissions 7
Credit contracts covering:
Loans Trading account profits/(losses) and commissions (2)
Other Trading account profits/(losses) and commissions 10
Equity contracts – trading activity Trading account profits/(losses) and commissions (53)
Other contracts:
IRLCs Mortgage production related income 392
Total $767
1During the year ended December 31, 2010, the Company reclassified $130 million in pre-tax gains from AOCI into net interest income. These gains related
to hedging relationships that have been previously terminated or de-designated.
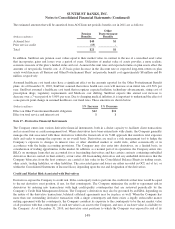
Year Ended December 31, 2009
(Dollars in millions)
Derivatives in cash flow hedging
relationships
Amount of pre-tax gain/(loss)
recognized in OCI on Derivatives
(Effective Portion)
Classification of gain/(loss)
reclassified from AOCI into Income
(Effective Portion)
Amount of pre-tax gain/(loss)
reclassified from AOCI into Income
(Effective Portion) 1
Equity contracts hedging:
Securities AFS ($296) $ -
Interest rate contracts hedging:
Floating rate loans 99 Interest and fees on loans 503
Floating rate CDs (1) Interest on deposits (47)
Floating rate debt - Interest on long-term debt (1)
Total ($198) $455
(Dollars in millions)
Derivatives not designated as hedging
instruments
Classification of gain/(loss) recognized in Income on
Derivatives
Amount of gain/(loss) recognized in
Income on Derivatives for the year
ended December 31, 2009
Interest rate contracts covering:
Fixed rate debt Trading account profits/(losses) and commissions ($61)
Corporate bonds and loans Trading account profits/(losses) and commissions 7
MSRs Mortgage servicing related income (88)
LHFS, IRLCs, LHFI-FV Mortgage production related income (75)
Trading activity Trading account profits/(losses) and commissions 46
Foreign exchange rate contracts covering:
Foreign-denominated debt and
commercial loans Trading account profits/(losses) and commissions 72
Trading activity Trading account profits/(losses) and commissions (4)
Credit contracts covering:
Loans Trading account profits/(losses) and commissions (20)
Equity contracts – trading activity Trading account profits/(losses) and commissions 23
Other contracts:
IRLCs Mortgage production related income 630
Trading activity Trading account profits/(losses) and commissions 3
Total $533
1During the year ended December 31, 2009, the Company reclassified $31 million in pre-tax gains from AOCI into net interest income. These gains related
to hedging relationships that have been previously terminated or de-designated.
153