SunTrust 2010 Annual Report Download - page 178
Download and view the complete annual report
Please find page 178 of the 2010 SunTrust annual report below. You can navigate through the pages in the report by either clicking on the pages listed below, or by using the keyword search tool below to find specific information within the annual report.-
 1
1 -
2
-
3
-
4
-
5
-
6
-
7
-
8
-
9
-
10
-
11
-
12
-
13
-
14
-
15
-
16
-
17
-
18
-
19
-
20
-
21
-
22
-
23
-
24
-
25
-
26
-
27
-
28
-
29
-
30
-
31
-
32
-
33
-
34
-
35
-
36
-
37
-
38
-
39
-
40
-
41
-
42
-
43
-
44
-
45
-
46
-
47
-
48
-
49
-
50
-
51
-
52
-
53
-
54
-
55
-
56
-
57
-
58
-
59
-
60
-
61
-
62
-
63
-
64
-
65
-
66
-
67
-
68
-
69
-
70
-
71
-
72
-
73
-
74
-
75
-
76
-
77
-
78
-
79
-
80
-
81
-
82
-
83
-
84
-
85
-
86
-
87
-
88
-
89
-
90
-
91
-
92
-
93
-
94
-
95
-
96
-
97
-
98
-
99
-
100
-
101
-
102
-
103
-
104
-
105
-
106
-
107
-
108
-
109
-
110
-
111
-
112
-
113
-
114
-
115
-
116
-
117
-
118
-
119
-
120
-
121
-
122
-
123
-
124
-
125
-
126
-
127
-
128
-
129
-
130
-
131
-
132
-
133
-
134
-
135
-
136
-
137
-
138
-
139
-
140
-
141
-
142
-
143
-
144
-
145
-
146
-
147
-
148
-
149
-
150
-
151
-
152
-
153
-
154
-
155
-
156
-
157
-
158
-
159
-
160
-
161
-
162
-
163
-
164
-
165
-
166
-
167
-
 168
168 -
 169
169 -
 170
170 -
 171
171 -
 172
172 -
 173
173 -
 174
174 -
 175
175 -
 176
176 -
 177
177 -
 178
178 -
 179
179 -
 180
180 -
 181
181 -
 182
182 -
 183
183 -
 184
184 -
 185
185 -
 186
186 -
 187
187 -
 188
188 -
189
-
190
-
191
-
192
-
193
-
194
-
195
-
196
-
197
-
198
-
199
-
200
-
201
-
202
-
203
-
204
-
205
-
206
-
207
-
208
-
209
-
210
-
211
-
212
-
213
-
214
-
215
-
216
-
217
-
218
-
219
-
220
 |
 |
SUNTRUST BANKS, INC.
Notes to Consolidated Financial Statements (Continued)
Note 20 - Fair Value Election and Measurement
The Company carries certain assets and liabilities at fair value on a recurring basis and appropriately classifies them as level
1, level 2 or level 3 within the fair value hierarchy. The Company’s recurring fair value measurements are based on a
requirement to carry such assets and liabilities at fair value or the Company’s election to carry certain financial assets and
financial liabilities at fair value. Assets and liabilities that are required to be carried at fair value on a recurring basis include
trading securities, securities AFS, and derivative financial instruments. Assets and liabilities that the Company has elected to
carry at fair value on a recurring basis include certain LHFI and LHFS, MSRs, certain brokered deposits, and certain
issuances of fixed rate debt.
In certain circumstances, fair value enables a company to more accurately align its financial performance with the economic
value of actively traded or hedged assets or liabilities. Fair value also enables a company to mitigate the non-economic
earnings volatility caused from financial assets and financial liabilities being carried at different bases of accounting, as well
as to more accurately portray the active and dynamic management of a company’s balance sheet. In cases where the
Company believed that fair value was more representative of the results of its activities, the Company elected to carry certain
financial instruments at fair value, as discussed further herein.
The classification of an instrument as level 3 versus level 2 involves judgment and is based on a variety of subjective factors.
A market is considered “inactive” if significant decreases in the volume and level of activity for the asset or liability have
been observed. In determining whether a market is inactive, the Company evaluates such factors as the number of recent
transactions in either the primary or secondary markets, whether price quotations are current, the nature of the market
participants, the variability of price quotations, the significance of bid/ask spreads, declines in (or the absence of) new
issuances, and the availability of public information. Inactive markets necessitate the use of additional judgment when
valuing financial instruments, such as pricing matrices, cash flow modeling, and the selection of an appropriate discount rate.
The assumptions used to estimate the value of an instrument where the market was inactive were based on the Company’s
assessment of the assumptions a market participant would use to value the instrument in an orderly transaction and included
considerations of illiquidity in the current market environment. Where the Company determined that a significant decrease in
the volume and level of activity had occurred, the Company was then required to evaluate whether significant adjustments
were required to market data to arrive at an exit price.
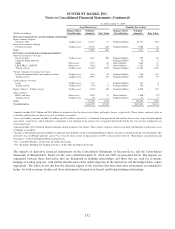
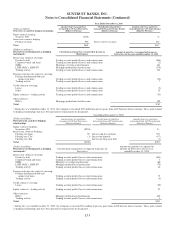
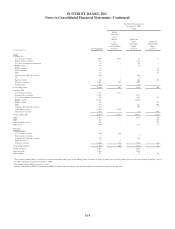
The following tables present certain information regarding assets and liabilities measured at fair value on a recurring basis and
the changes in fair value for those specific financial instruments in which fair value has been elected. The tables do not reflect
the change in fair value attributable to the related economic hedges the Company used to mitigate the market-related risks
associated with the financial instruments. The changes in the fair value of economic hedges were also recorded in trading
account profits/(losses) and commissions, mortgage production related income, or mortgage servicing related income/(loss), as
appropriate, and are designed to partially offset the change in fair value of the financial instruments referenced in the tables
below. The Company’s economic hedging activities are deployed at both the instrument and portfolio level.
162