SunTrust 2010 Annual Report Download - page 188
Download and view the complete annual report
Please find page 188 of the 2010 SunTrust annual report below. You can navigate through the pages in the report by either clicking on the pages listed below, or by using the keyword search tool below to find specific information within the annual report.-
 1
1 -
2
-
3
-
4
-
5
-
6
-
7
-
8
-
9
-
10
-
11
-
12
-
13
-
14
-
15
-
16
-
17
-
18
-
19
-
20
-
21
-
22
-
23
-
24
-
25
-
26
-
27
-
28
-
29
-
30
-
31
-
32
-
33
-
34
-
35
-
36
-
37
-
38
-
39
-
40
-
41
-
42
-
43
-
44
-
45
-
46
-
47
-
48
-
49
-
50
-
51
-
52
-
53
-
54
-
55
-
56
-
57
-
58
-
59
-
60
-
61
-
62
-
63
-
64
-
65
-
66
-
67
-
68
-
69
-
70
-
71
-
72
-
73
-
74
-
75
-
76
-
77
-
78
-
79
-
80
-
81
-
82
-
83
-
84
-
85
-
86
-
87
-
88
-
89
-
90
-
91
-
92
-
93
-
94
-
95
-
96
-
97
-
98
-
99
-
100
-
101
-
102
-
103
-
104
-
105
-
106
-
107
-
108
-
109
-
110
-
111
-
112
-
113
-
114
-
115
-
116
-
117
-
118
-
119
-
120
-
121
-
122
-
123
-
124
-
125
-
126
-
127
-
128
-
129
-
130
-
131
-
132
-
133
-
134
-
135
-
136
-
137
-
138
-
139
-
140
-
141
-
142
-
143
-
144
-
145
-
146
-
147
-
148
-
149
-
150
-
151
-
152
-
153
-
154
-
155
-
156
-
157
-
158
-
159
-
160
-
161
-
162
-
163
-
164
-
165
-
166
-
167
-
168
-
169
-
170
-
171
-
172
-
173
-
174
-
175
-
176
-
177
-
 178
178 -
 179
179 -
 180
180 -
 181
181 -
 182
182 -
 183
183 -
 184
184 -
 185
185 -
 186
186 -
 187
187 -
 188
188 -
 189
189 -
 190
190 -
 191
191 -
 192
192 -
 193
193 -
 194
194 -
 195
195 -
 196
196 -
 197
197 -
 198
198 -
199
-
200
-
201
-
202
-
203
-
204
-
205
-
206
-
207
-
208
-
209
-
210
-
211
-
212
-
213
-
214
-
215
-
216
-
217
-
218
-
219
-
220
 |
 |

SUNTRUST BANKS, INC.
Notes to Consolidated Financial Statements (Continued)
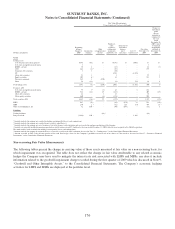
Level 2 LHFS are primarily agency loans which trade in active secondary markets and are priced using current
market pricing for similar securities adjusted for servicing and risk. Level 3 loans are primarily non-agency
residential mortgage LHFI or LHFS for which there is little to no observable trading activity of similar instruments
in either the new issuance or secondary loan markets as either whole loans or as securities. Prior to the non-agency
residential loan market disruption, which began during the third quarter of 2007 and continues, the Company was
able to obtain certain observable pricing from either the new issuance or secondary loan market. However, as the
markets deteriorated and certain loans were not actively trading as either whole loans or as securities, the Company
began employing the same alternative valuation methodologies used to value level 3 residential MBS to fair value
the loans.
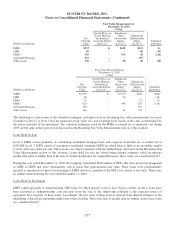
During the year ended December 31, 2010, the Company transferred $160 million of NPLs that were previously
designated as held for investment to held for sale that were subsequently sold at prices that approximated fair value.
These loans were predominantly reported at amortized cost prior to transferring to held for sale; however, a portion
of the NPLs was carried at fair value. There were no similar transfers during the year ended December 31, 2009.
As disclosed in the tabular level 3 rollforwards, transfers of certain mortgage LHFS into level 3 during 2009 and
2010 were largely due to borrower defaults or the identification of other loan defects impacting the marketability of
the loans.
For residential loans that the Company has elected to carry at fair value, the Company has considered the component
of the fair value changes due to instrument-specific credit risk, which is intended to be an approximation of the fair
value change attributable to changes in borrower-specific credit risk. For the years ended December 31, 2010, 2009
and 2008, the Company recognized losses in the Consolidated Statements of Income/(Loss) of $18 million, $24
million, and $47 million, respectively, due to changes in fair value attributable to borrower-specific credit risk. In
addition to borrower-specific credit risk, there are other, more significant, variables that drive changes in the fair
values of the loans, including interest rates and general conditions in the principal markets for the loans.
Corporate and other LHFS
As discussed in Note 11, “Certain Transfers of Financial Assets, Mortgage Servicing Rights and Variable Interest
Entities,” the Company has determined that it is the primary beneficiary of a CLO vehicle, which resulted in the
Company consolidating the loans of that vehicle. Because the CLO trades its loans from time to time and in order to
fairly present the economics of the CLO, the Company elected to carry the loans of the CLO at fair value. The
Company is able to obtain fair value estimates for substantially all of these loans using a reputable, third party
valuation service that is broadly used by market participants. While most of the loans are traded in the markets, the
Company does not believe the loans qualify as level 1 instruments, as the volume and level of trading activity is
subject to variability and the loans are not exchange-traded, such that the Company believes that level 2 is more
representative of the general market activity for the loans.
LHFI
Level 3 LHFI include $4 million of loans that were acquired through the acquisition of GB&T. The loans the
Company elected to account for at fair value are primarily nonperforming CRE loans, which do not trade in an active
secondary market. As these loans are classified as nonperforming, cash proceeds from the sale of the underlying
collateral is the expected source of repayment for a majority of these loans. Accordingly, the fair value of these loans
is derived from internal estimates, incorporating market data when available, of the value of the underlying
collateral. Additionally, level 3 LHFI include $488 million of mortgage loans that have been deemed not marketable,
largely due to borrower defaults or the identification of other loan defects.
Other Intangible Assets
Other intangible assets that the Company records at fair value are the Company’s MSR asset. As further discussed in Note
11, “Certain Transfers of Financial Assets, Mortgage Servicing Rights and Variable Interest Entities,” beginning January 1,
2010, the Company elected to account for all MSRs at fair value. The fair values of MSRs are determined by projecting cash
flows, which are then discounted to estimate an expected fair value. The fair values of MSRs are impacted by a variety of
factors, including prepayment assumptions, discount rates, delinquency rates, contractually specified servicing fees, and
172