SunTrust 2010 Annual Report Download - page 65
Download and view the complete annual report
Please find page 65 of the 2010 SunTrust annual report below. You can navigate through the pages in the report by either clicking on the pages listed below, or by using the keyword search tool below to find specific information within the annual report.-
 1
1 -
2
-
3
-
4
-
5
-
6
-
7
-
8
-
9
-
10
-
11
-
12
-
13
-
14
-
15
-
16
-
17
-
18
-
19
-
20
-
21
-
22
-
23
-
24
-
25
-
26
-
27
-
28
-
29
-
30
-
31
-
32
-
33
-
34
-
35
-
36
-
37
-
38
-
39
-
40
-
41
-
42
-
43
-
44
-
45
-
46
-
47
-
48
-
49
-
50
-
51
-
52
-
53
-
54
-
 55
55 -
 56
56 -
 57
57 -
 58
58 -
 59
59 -
 60
60 -
 61
61 -
 62
62 -
 63
63 -
 64
64 -
 65
65 -
 66
66 -
 67
67 -
 68
68 -
 69
69 -
 70
70 -
 71
71 -
 72
72 -
 73
73 -
 74
74 -
 75
75 -
76
-
77
-
78
-
79
-
80
-
81
-
82
-
83
-
84
-
85
-
86
-
87
-
88
-
89
-
90
-
91
-
92
-
93
-
94
-
95
-
96
-
97
-
98
-
99
-
100
-
101
-
102
-
103
-
104
-
105
-
106
-
107
-
108
-
109
-
110
-
111
-
112
-
113
-
114
-
115
-
116
-
117
-
118
-
119
-
120
-
121
-
122
-
123
-
124
-
125
-
126
-
127
-
128
-
129
-
130
-
131
-
132
-
133
-
134
-
135
-
136
-
137
-
138
-
139
-
140
-
141
-
142
-
143
-
144
-
145
-
146
-
147
-
148
-
149
-
150
-
151
-
152
-
153
-
154
-
155
-
156
-
157
-
158
-
159
-
160
-
161
-
162
-
163
-
164
-
165
-
166
-
167
-
168
-
169
-
170
-
171
-
172
-
173
-
174
-
175
-
176
-
177
-
178
-
179
-
180
-
181
-
182
-
183
-
184
-
185
-
186
-
187
-
188
-
189
-
190
-
191
-
192
-
193
-
194
-
195
-
196
-
197
-
198
-
199
-
200
-
201
-
202
-
203
-
204
-
205
-
206
-
207
-
208
-
209
-
210
-
211
-
212
-
213
-
214
-
215
-
216
-
217
-
218
-
219
-
220
 |
 |
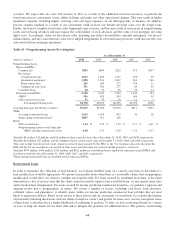
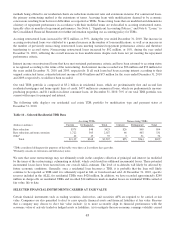
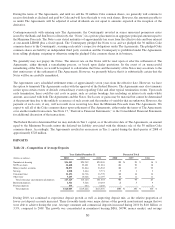
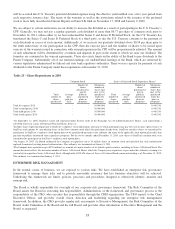
For the year ended December 31, 2010, the average yield on a FTE basis for the securities AFS portfolio declined to 3.21%
compared to 4.23% for the year ended December 31, 2009. The yield decline was largely due to security maturities,
prepayments, and sales, with the proceeds generally reinvested at current lower yields. Additionally, the portfolio’s yield was
impacted by the purchase of lower yielding U.S. Treasury securities in late 2009.
The portfolio’s effective duration increased to 3.3% as of December 31, 2010 from 3.0% as of December 31, 2009. Effective
duration is a measure of price sensitivity of a bond portfolio to an immediate change in market interest rates, taking into
consideration embedded options. An effective duration of 3.3% suggests an expected price change of 3.3% for a one percent
instantaneous change in market interest rates.
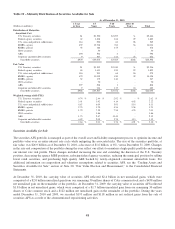
The credit quality of the securities portfolio remained strong at December 31, 2010. Excluding the $2.9 billion of fair value
represented by equity securities, $23.0 billion, or 96%, of the remaining $24.0 billion in securities AFS carried an actual or
implied AAA rating, the highest possible, as designated by at least one NRSRO. The amount of ARS recorded in the
securities AFS portfolio totaled $128 million as of December 31, 2010 and $156 million as of December 31, 2009. Included
in ARS are tax-exempt municipal securities as well as student loan ABS.
Due to the high quality and highly liquid nature of the portfolio, we have the flexibility to respond to changes in the
economic environment and take actions as opportunities arise to manage our interest rate risk profile and balance liquidity
against investment returns. Going forward, we will continue to evaluate opportunities to reduce our risk to a further
steepening of the yield curve. Over the longer term, we continue to expect that a growing economy will result in loan
balances trending up and deposits trending down. Accordingly, we may eventually decrease the size of our securities
portfolio in response to loan growth and/or declining deposits.
INVESTMENT IN COMMON SHARES OF THE COCA-COLA COMPANY
Background
We have owned common shares of Coke since 1919, when one of our predecessor institutions participated in the
underwriting of Coke’s IPO and received common shares of Coke in lieu of underwriting fees. These shares have grown in
value over the past 91 years and have been classified as securities AFS, with unrealized gains, net of tax, recorded as a
component of shareholders’ equity. Because of the low accounting cost basis of these shares, we have accumulated
significant unrealized gains in shareholders’ equity. As of December 31, 2010, we owned 30 million Coke shares with an
accounting cost basis of $69,295 and a fair market value of $2.0 billion.
We commenced a comprehensive balance sheet review initiative in early 2007 in an effort to improve liquidity and capital
efficiency. As part of this initiative, we began to formally evaluate the capital efficiency of our holdings of Coke common
shares, as we were prohibited from including the market value of our investment in Coke common shares in Tier 1 capital in
accordance with Federal Reserve capital adequacy rules. As a result of this initiative, at various times during 2007 and 2008
we sold and made a charitable contribution of all but 30 million shares of our Coke stock. Additionally, during the second
half of 2008, we executed The Agreements on the remaining 30 million shares that we owned. Our primary objective in
executing these transactions was to optimize the benefits we obtained from our long-term holding of this asset, including the
capital treatment by bank regulators.
We entered into The Agreements, which were comprised of two variable forward agreements and share forward agreements
effective July 15, 2008 with a major, unaffiliated financial institution (the “Counterparty”) collectively covering our
30 million Coke shares. Under The Agreements, we must deliver to the Counterparty at settlement of the variable forward
agreements either a variable number of Coke common shares or a cash payment in lieu of such shares. The Counterparty is
obligated to settle The Agreements for no less than approximately $38.67 per share, or approximately $1.16 billion in the
aggregate (the “Minimum Proceeds”). The share forward agreements give us the right, but not the obligation, to sell to the
Counterparty, at prevailing market prices at the time of settlement, any of the 30 million Coke common shares that are not
delivered to the Counterparty in settlement of the variable forward agreements. The Agreements effectively ensure that we
will be able to sell our 30 million Coke common shares at a price no less than approximately $38.67 per share, while
permitting us to participate in future appreciation in the value of the Coke common shares up to approximately $66.02 per
share and approximately $65.72 per share, under each of the respective Agreements.
49