SunTrust 2010 Annual Report Download - page 106
Download and view the complete annual report
Please find page 106 of the 2010 SunTrust annual report below. You can navigate through the pages in the report by either clicking on the pages listed below, or by using the keyword search tool below to find specific information within the annual report.-
 1
1 -
2
-
3
-
4
-
5
-
6
-
7
-
8
-
9
-
10
-
11
-
12
-
13
-
14
-
15
-
16
-
17
-
18
-
19
-
20
-
21
-
22
-
23
-
24
-
25
-
26
-
27
-
28
-
29
-
30
-
31
-
32
-
33
-
34
-
35
-
36
-
37
-
38
-
39
-
40
-
41
-
42
-
43
-
44
-
45
-
46
-
47
-
48
-
49
-
50
-
51
-
52
-
53
-
54
-
55
-
56
-
57
-
58
-
59
-
60
-
61
-
62
-
63
-
64
-
65
-
66
-
67
-
68
-
69
-
70
-
71
-
72
-
73
-
74
-
75
-
76
-
77
-
78
-
79
-
80
-
81
-
82
-
83
-
84
-
85
-
86
-
87
-
88
-
89
-
90
-
91
-
92
-
93
-
94
-
95
-
 96
96 -
 97
97 -
 98
98 -
 99
99 -
 100
100 -
 101
101 -
 102
102 -
 103
103 -
 104
104 -
 105
105 -
 106
106 -
 107
107 -
 108
108 -
 109
109 -
 110
110 -
 111
111 -
 112
112 -
 113
113 -
 114
114 -
 115
115 -
 116
116 -
117
-
118
-
119
-
120
-
121
-
122
-
123
-
124
-
125
-
126
-
127
-
128
-
129
-
130
-
131
-
132
-
133
-
134
-
135
-
136
-
137
-
138
-
139
-
140
-
141
-
142
-
143
-
144
-
145
-
146
-
147
-
148
-
149
-
150
-
151
-
152
-
153
-
154
-
155
-
156
-
157
-
158
-
159
-
160
-
161
-
162
-
163
-
164
-
165
-
166
-
167
-
168
-
169
-
170
-
171
-
172
-
173
-
174
-
175
-
176
-
177
-
178
-
179
-
180
-
181
-
182
-
183
-
184
-
185
-
186
-
187
-
188
-
189
-
190
-
191
-
192
-
193
-
194
-
195
-
196
-
197
-
198
-
199
-
200
-
201
-
202
-
203
-
204
-
205
-
206
-
207
-
208
-
209
-
210
-
211
-
212
-
213
-
214
-
215
-
216
-
217
-
218
-
219
-
220
 |
 |

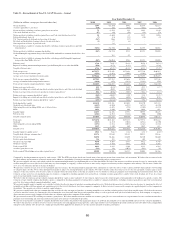
SUNTRUST BANKS, INC.
Consolidated Statements of Income/(Loss)
For the Year Ended December 31
(Dollars and shares in millions, except per share data) 2010 2009 2008
Interest Income
Interest and fees on loans $5,300 $5,530 $6,934
Interest and fees on loans held for sale 137 233 290
Interest and dividends on securities available for sale
Taxable interest 709 717 628
Tax-exempt interest 31 40 44
Dividends176 73 103
Trading account interest 89 115 303
Other interest income 12 26
Total interest income 6,343 6,710 8,328
Interest Expense
Interest on deposits 860 1,440 2,378
Interest on funds purchased and securities sold under agreements to repurchase 68 131
Interest on trading liabilities 30 20 27
Interest on other short-term borrowings 13 15 55
Interest on long-term debt 580 761 1,117
Total interest expense 1,489 2,244 3,708
Net interest income 4,854 4,466 4,620
Provision for credit losses 2,651 4,064 2,474
Net interest income after provision for credit losses 2,203 402 2,146
Noninterest Income
Service charges on deposit accounts 760 848 904
Other charges and fees 534 523 511
Trust and investment management income 503 486 592
Card fees 376 324 308
Mortgage production related income 127 376 171
Mortgage servicing related income/(loss) 358 330 (212)
Investment banking income 313 272 237
Retail investment services 205 218 289
Net securities gains2191 98 1,073
Trading account profits/(losses) and commissions 173 (41) 38
Gain from ownership in Visa -112 86
Net gain on sale of businesses -- 198
Net gain on sale/leaseback of premises --37
Other noninterest income 189 164 241
Total noninterest income 3,729 3,710 4,473
Noninterest Expense
Employee compensation 2,364 2,258 2,327
Employee benefits 457 542 434
Outside processing and software 638 579 493
Net occupancy expense 361 357 347
Other real estate expense 300 244 105
Credit and collection services 279 259 156
Regulatory assessments 265 302 55
Marketing and customer development 177 152 372
Equipment expense 174 172 203
Operating losses 83 99 446
Net loss on debt extinguishment 70 39 12
Amortization/impairment of goodwill/intangible assets 51 807 121
Mortgage reinsurance 27 115 180
Visa litigation -7 (33)
Other noninterest expense 665 630 661
Total noninterest expense 5,911 6,562 5,879
Income/(loss) before provision/(benefit) for income taxes 21 (2,450) 740
Provision/(benefit) for income taxes (185) (898) (67)
Net income/(loss) including income attributable to noncontrolling interest 206 (1,552) 807
Net income attributable to noncontrolling interest 17 12 11
Net income/(loss) $189 ($1,564) $796
Net income/(loss) available to common shareholders ($87) ($1,733) $741
Net income/(loss) per average common share
Diluted3($0.18) ($3.98) $2.12
Basic (0.18) (3.98) 2.12
Dividends declared per common share 0.04 0.22 2.85
Average common shares - diluted 499 437 350
Average common shares - basic 495 435 349
1Includes dividends on common stock of The Coca-Cola Company. $53 $49 $56
2Includes other-than-temporary impairment losses of $2 million and $20 million, consisting of $2 million and $113 million of total unrealized losses, net of $0 and $93 million of non-credit
related unrealized losses recorded in other comprehensive income, before taxes, for the years ended December 31, 2010 and 2009, respectively. Includes other-than-temporary impairment loss
of $84 million for the year ended December 31, 2008.
3For earnings per share calculation purposes, the impact of dilutive securities are excluded from the diluted share count during periods that the Company has recognized a net loss available to
common shareholders because the impact would be anti-dilutive.
See Notes to Consolidated Financial Statements.
90