SunTrust 2010 Annual Report Download - page 92
Download and view the complete annual report
Please find page 92 of the 2010 SunTrust annual report below. You can navigate through the pages in the report by either clicking on the pages listed below, or by using the keyword search tool below to find specific information within the annual report.-
 1
1 -
2
-
3
-
4
-
5
-
6
-
7
-
8
-
9
-
10
-
11
-
12
-
13
-
14
-
15
-
16
-
17
-
18
-
19
-
20
-
21
-
22
-
23
-
24
-
25
-
26
-
27
-
28
-
29
-
30
-
31
-
32
-
33
-
34
-
35
-
36
-
37
-
38
-
39
-
40
-
41
-
42
-
43
-
44
-
45
-
46
-
47
-
48
-
49
-
50
-
51
-
52
-
53
-
54
-
55
-
56
-
57
-
58
-
59
-
60
-
61
-
62
-
63
-
64
-
65
-
66
-
67
-
68
-
69
-
70
-
71
-
72
-
73
-
74
-
75
-
76
-
77
-
78
-
79
-
80
-
81
-
 82
82 -
 83
83 -
 84
84 -
 85
85 -
 86
86 -
 87
87 -
 88
88 -
 89
89 -
 90
90 -
 91
91 -
 92
92 -
 93
93 -
 94
94 -
 95
95 -
 96
96 -
 97
97 -
 98
98 -
 99
99 -
 100
100 -
 101
101 -
 102
102 -
103
-
104
-
105
-
106
-
107
-
108
-
109
-
110
-
111
-
112
-
113
-
114
-
115
-
116
-
117
-
118
-
119
-
120
-
121
-
122
-
123
-
124
-
125
-
126
-
127
-
128
-
129
-
130
-
131
-
132
-
133
-
134
-
135
-
136
-
137
-
138
-
139
-
140
-
141
-
142
-
143
-
144
-
145
-
146
-
147
-
148
-
149
-
150
-
151
-
152
-
153
-
154
-
155
-
156
-
157
-
158
-
159
-
160
-
161
-
162
-
163
-
164
-
165
-
166
-
167
-
168
-
169
-
170
-
171
-
172
-
173
-
174
-
175
-
176
-
177
-
178
-
179
-
180
-
181
-
182
-
183
-
184
-
185
-
186
-
187
-
188
-
189
-
190
-
191
-
192
-
193
-
194
-
195
-
196
-
197
-
198
-
199
-
200
-
201
-
202
-
203
-
204
-
205
-
206
-
207
-
208
-
209
-
210
-
211
-
212
-
213
-
214
-
215
-
216
-
217
-
218
-
219
-
220
 |
 |
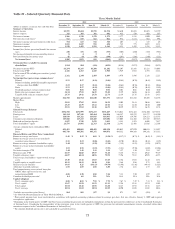
FOURTH QUARTER 2010 RESULTS
We reported net income available to common shareholders of $114 million for the fourth quarter of 2010, a $430 million
improvement over the same period of the prior year. Earnings per average common share was $0.23 for the fourth quarter of
2010, which compares favorably to the net loss of $0.64 per average common share for the fourth quarter of 2009. The fourth
quarter of 2010 results were favorably driven by a lower provision for credit losses, resulting from improved credit quality,
and solid revenues. Additionally, net charge-offs, NPLs, nonperforming assets and early stage delinquencies declined.
Average customer deposits grew, and the favorable deposit mix trends experienced throughout 2010 were sustained during
the fourth quarter.
For the fourth quarter of 2010, net interest income-FTE was $1.3 billion, an increase of $87 million, or 7%, compared to the
fourth quarter of 2009. Net interest income growth was attributable to lower rates paid on deposits and borrowed funds, the
continued shift in the deposit mix toward lower-cost accounts, and a significant reduction in long-term debt. Net interest
margin increased 17 basis points to 3.44% in the fourth quarter of 2010 compared to 3.27% for the same period of 2009,
primarily driven by a 38 basis point decline in rates paid on interest-bearing liabilities, which more than offset a 17 basis
point decline in earning asset yields.
For the fourth quarter of 2010, the provision for credit losses was $512 million compared to $974 million in the fourth
quarter of 2009. The decline was due to lower net charge-offs and improved credit quality.
Total noninterest income was $1.0 billion for the fourth quarter of 2010, an increase of $290 million, or 39%, from the fourth
quarter of 2009. This increase was primarily driven by higher capital markets and mortgage-related income, as well as higher
mark-to-market valuation impacts, partially offset by lower service charges. Compared to the fourth quarter of 2009, mortgage
production related income increased $109 million primarily due to a $135 million decline in the provision for mortgage
repurchase losses. The fourth quarter of 2010 results include $85 million in provision for losses related to the potential
repurchase of mortgage loans that were previously sold to third parties, down from $220 million recorded in the fourth quarter
of 2009. Mortgage servicing income increased $21 million compared to the fourth quarter of 2009, as a result of higher net
hedge performance. Trading account profits/(losses) and commissions increased $124 million compared to the fourth quarter of
2009. The increase was largely driven by a $54 million increase in mark-to-market valuation gains on public debt carried at fair
value, net of hedges, an approximate $30 million related to lower valuation losses on previously securitized and sold loans, and
the net impact gains on the sale of, and improved market valuations on, assets carried at fair value. Consumer and commercial
fee-based income in the fourth quarter of 2010 were essentially flat compared to the fourth quarter of 2009, as strong investment
banking income and card fees were offset by lower service charges on deposits as a result of recently enacted regulations. Other
income in the fourth quarter of 2010 included a $13 million gain recognized upon the previously-announced sale of the money
market mutual fund business. During the fourth quarter of 2010, we recorded $64 million of net gains from the sale of securities
AFS compared to $73 million of net gains from the sale of securities AFS in the fourth quarter of 2009 that were realized in
conjunction with risk management strategies associated with the repositioning of our investment portfolio.
Total noninterest expense was $1.5 billion during the fourth quarter of 2010, an increase of $95 million, or 7%, compared to
the fourth quarter of 2009. The expense increase was primarily due to investments that are expected to enhance future
revenue generation capabilities. Employee compensation and benefits increased $44 million, or 6%, from the fourth quarter
of 2009. This increase was driven by higher salaries, mostly due to the addition of 1,055 full-time equivalent employees.
Additionally, higher incentive compensation related to improved financial performance in certain business lines contributed
to the increase. Outside processing and software expense increased $25 million, or 17%, over the prior year quarter due to
increased expenses associated with client acquisition and risk management technology projects and higher transaction
volumes. Marketing and customer development expenses increased $8 million, or 17%, compared to the fourth quarter of
2009, attributable to increases in promotional and advertising spending, as well as supporting our branding and client service
initiatives. Credit-related costs were $189 million in the fourth quarter of 2010, up $15 million from the fourth quarter of
2009, driven by higher other real estate losses. The fourth quarter of 2010 also included $4 million in net losses on the
extinguishment of debt compared to $23 million in the fourth quarter of 2009 from early termination fees related to FHLB
advances repaid, net of gains on the early extinguishment of other long-term debt. These advance terminations were part of
the initiative we took to take advantage of the strong liquidity position we currently benefit from to repay wholesale funding
and continue to improve net interest margin.
The income tax provision for the fourth quarter of 2010 was $45 million compared to the income tax benefit of $263 million
for the fourth quarter of 2009. The increase in the income tax provision was primarily attributable to pre-tax income recorded
in the fourth quarter of 2010 compared to a pre-tax loss in the same period in 2009.
76