SunTrust 2010 Annual Report Download - page 93
Download and view the complete annual report
Please find page 93 of the 2010 SunTrust annual report below. You can navigate through the pages in the report by either clicking on the pages listed below, or by using the keyword search tool below to find specific information within the annual report.
BUSINESS SEGMENTS
See Note 22, “Business Segment Reporting,” to the Consolidated Financial Statements for discussion of our segment
structure, basis of presentation and internal management reporting methodologies.
The following table for our reportable business segments compares net income/(loss) for the year ended December 31, 2010
to the same period in 2009 and 2008:
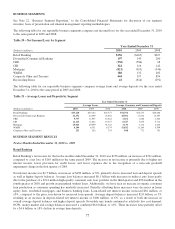
Table 30 – Net Income/(Loss) by Segment
Year Ended December 31
(Dollars in millions) 2010 2009 2008
Retail Banking $156 ($165) $227
Diversified Commercial Banking 197 149 200
CRE (330) (584) 28
CIB 322 116 142
Mortgage (821) (995) (546)
W&IM 180 132 182
Corporate Other and Treasury 444 397 854
Reconciling Items 41 (614) (291)
The following table for our reportable business segments compares average loans and average deposits for the year ended
December 31, 2010 to the same period in 2009 and 2008:
Table 31 – Average Loans and Deposits by Segment
Year Ended December 31
Average Loans Average Consumer and Commercial Deposits
(Dollars in millions) 2010 2009 2008 2010 2009 2008
Retail Banking $33,220 $33,152 $33,777 $74,756 $72,757 $68,088
Diversified Commercial Banking 22,371 24,399 25,064 18,501 17,644 13,497
CRE 9,757 12,507 13,464 1,561 1,888 1,622
CIB 11,225 12,842 13,357 6,617 5,855 5,714
Mortgage 29,043 29,599 31,342 3,135 3,134 2,238
W&IM 8,106 8,351 8,174 11,832 11,184 9,504
Corporate Other and Treasury 251 203 274 848 772 761
BUSINESS SEGMENT RESULTS
Twelve Months Ended December 31, 2010 vs. 2009
Retail Banking
Retail Banking’s net income for the twelve months ended December 31, 2010 was $156 million, an increase of $321 million,
compared to a net loss of $165 million in the same period 2009. The increase in net income is primarily due to higher net
interest income, lower provision for credit losses, and lower expenses due to the recognition of a non-cash goodwill
impairment charge in the first quarter of 2009.
Net interest income was $2.5 billion, an increase of $189 million, or 8%, primarily due to increased loan and deposit spreads
as well as higher deposit balances. Average loan balances increased $0.1 billion with increases in indirect auto loans partly
due to the purchase of a $741 million high-quality consumer auto loan portfolio in the third quarter and $934 million in the
fourth quarter of 2010 and growth in guaranteed student loans. Additionally, we have seen an increase in organic consumer
loan production as consumer spending has modestly increased. Partially offsetting those increases were decreases in home
equity lines, residential mortgages, and business banking loans. Loan-related net interest income increased $82 million, or
10%, compared to the prior year driven by increased loan spreads. Average deposit balances increased $2.0 billion, or 3%
resulting in an increase in deposit-related net interest income of $100 million, or 6%, as a result of both the increase in
overall average deposit balances and higher deposit spreads. Favorable mix trends continued as relatively low cost demand,
NOW, money market and savings balances increased a combined $6.6 billion, or 14%. These increases were partially offset
by a $4.6 billion, or 18% decline in average time deposits.
77


