SunTrust 2010 Annual Report Download - page 54
Download and view the complete annual report
Please find page 54 of the 2010 SunTrust annual report below. You can navigate through the pages in the report by either clicking on the pages listed below, or by using the keyword search tool below to find specific information within the annual report.-
 1
1 -
2
-
3
-
4
-
5
-
6
-
7
-
8
-
9
-
10
-
11
-
12
-
13
-
14
-
15
-
16
-
17
-
18
-
19
-
20
-
21
-
22
-
23
-
24
-
25
-
26
-
27
-
28
-
29
-
30
-
31
-
32
-
33
-
34
-
35
-
36
-
37
-
38
-
39
-
40
-
41
-
42
-
43
-
 44
44 -
 45
45 -
 46
46 -
 47
47 -
 48
48 -
 49
49 -
 50
50 -
 51
51 -
 52
52 -
 53
53 -
 54
54 -
 55
55 -
 56
56 -
 57
57 -
 58
58 -
 59
59 -
 60
60 -
 61
61 -
 62
62 -
 63
63 -
 64
64 -
65
-
66
-
67
-
68
-
69
-
70
-
71
-
72
-
73
-
74
-
75
-
76
-
77
-
78
-
79
-
80
-
81
-
82
-
83
-
84
-
85
-
86
-
87
-
88
-
89
-
90
-
91
-
92
-
93
-
94
-
95
-
96
-
97
-
98
-
99
-
100
-
101
-
102
-
103
-
104
-
105
-
106
-
107
-
108
-
109
-
110
-
111
-
112
-
113
-
114
-
115
-
116
-
117
-
118
-
119
-
120
-
121
-
122
-
123
-
124
-
125
-
126
-
127
-
128
-
129
-
130
-
131
-
132
-
133
-
134
-
135
-
136
-
137
-
138
-
139
-
140
-
141
-
142
-
143
-
144
-
145
-
146
-
147
-
148
-
149
-
150
-
151
-
152
-
153
-
154
-
155
-
156
-
157
-
158
-
159
-
160
-
161
-
162
-
163
-
164
-
165
-
166
-
167
-
168
-
169
-
170
-
171
-
172
-
173
-
174
-
175
-
176
-
177
-
178
-
179
-
180
-
181
-
182
-
183
-
184
-
185
-
186
-
187
-
188
-
189
-
190
-
191
-
192
-
193
-
194
-
195
-
196
-
197
-
198
-
199
-
200
-
201
-
202
-
203
-
204
-
205
-
206
-
207
-
208
-
209
-
210
-
211
-
212
-
213
-
214
-
215
-
216
-
217
-
218
-
219
-
220
 |
 |

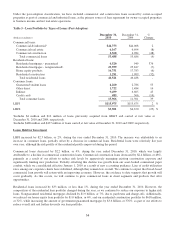
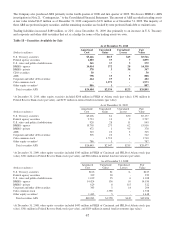
Policies in this MD&A for further information regarding our ALLL accounting policy, determination, and allocation. As
previously noted, while the reclassification of our loan types had no effect on total loan charge-offs and loan recoveries, SEC
regulations require us, in some instances, to present five years of comparable data where trend information may be deemed
relevant, in which case we have provided the pre-adoption charge-off and recovery classifications due to the inability to
restate prior periods under the new classifications.
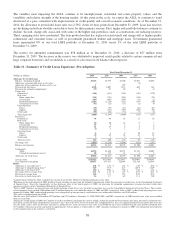
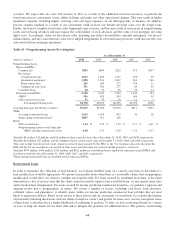
A rollforward of our allowance for credit losses, along with our summarized credit losses experience, is shown in the tables
below:
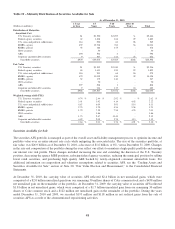
Table 10 - Summary of Credit Losses Experience (Post-Adoption)
For the Years
Ended December 31
(Dollars in millions) 2010 2009
Allowance for Credit Losses
Balance - beginning of period $3,235 $2,379
Allowance recorded upon VIE consolidation 1-
Provision for loan losses 2,708 4,007
Provision for unfunded commitments1(57) 87
Charge-offs:
Commercial loans (1,087) (1,432)
Residential loans (1,736) (1,707)
Consumer loans (195) (259)
Total charge-offs (3,018) (3,398)
Recoveries:
Commercial loans 99 84
Residential loans 20 17
Consumer loans 44 59
Total recoveries 163 160
Net charge-offs (2,855) (3,238)
Balance - end of period $3,032 $3,235
Components:
ALLL $2,974 $3,120
Unfunded commitments reserve258 115
Allowance for credit losses $3,032 $3,235
Average loans $113,925 $121,041
Year-end loans outstanding 115,975 113,675
Ratios:
Allowance to year-end loans3,4 2.58 % 2.76 %
Allowance to nonperforming loans372.86 58.86
Allowance to net charge-offs31.04 x 0.96 x
Net charge-offs to average loans 2.51 % 2.67 %
Provision for loan losses to average loans 2.38 3.31
Recoveries to total charge-offs 5.4 4.7
1Beginning in the fourth quarter of 2009, SunTrust began recording the provision for unfunded commitments within the provision for
credit losses in the Consolidated Statements of Income/(Loss). Given the immateriality of this provision, prior to the fourth quarter of
2009, the provision for unfunded commitments remains classified within other noninterest expense in the Consolidated Statements of
Income/(Loss).
2The unfunded commitments reserve is separately recorded in other liabilities in the Consolidated Balance Sheets.
3This ratio is calculated using the ALLL.
4For this ratio, $492 million and $449 million at December 31, 2010 and 2009, respectively, of LHFI carried at fair value were excluded
from year-end loans.
The ALLL decreased by $146 million, or 5%, during the year ended December 31, 2010. The decrease in ALLL reflects
improvements in asset quality during the year, partially mitigated by the continued uncertainty in the overall economic outlook.
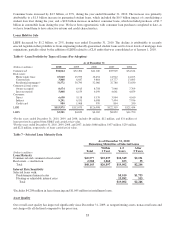
The ratio of the ALLL to total NPLs increased to 72.86% as of December 31, 2010 from 58.86% as of December 31, 2009.
The increase in this ratio was attributable to the $1.3 billion decrease in NPLs, partially offset by the decline in ALLL. The
decrease in NPLs was due to charge-offs recognized, the migration of loans to OREO, and reduced inflows into nonaccrual
status. See additional discussion regarding NPL trends in the “Nonperforming Assets” section of the MD&A.
38