SunTrust 2010 Annual Report Download - page 96
Download and view the complete annual report
Please find page 96 of the 2010 SunTrust annual report below. You can navigate through the pages in the report by either clicking on the pages listed below, or by using the keyword search tool below to find specific information within the annual report.-
 1
1 -
2
-
3
-
4
-
5
-
6
-
7
-
8
-
9
-
10
-
11
-
12
-
13
-
14
-
15
-
16
-
17
-
18
-
19
-
20
-
21
-
22
-
23
-
24
-
25
-
26
-
27
-
28
-
29
-
30
-
31
-
32
-
33
-
34
-
35
-
36
-
37
-
38
-
39
-
40
-
41
-
42
-
43
-
44
-
45
-
46
-
47
-
48
-
49
-
50
-
51
-
52
-
53
-
54
-
55
-
56
-
57
-
58
-
59
-
60
-
61
-
62
-
63
-
64
-
65
-
66
-
67
-
68
-
69
-
70
-
71
-
72
-
73
-
74
-
75
-
76
-
77
-
78
-
79
-
80
-
81
-
82
-
83
-
84
-
85
-
 86
86 -
 87
87 -
 88
88 -
 89
89 -
 90
90 -
 91
91 -
 92
92 -
 93
93 -
 94
94 -
 95
95 -
 96
96 -
 97
97 -
 98
98 -
 99
99 -
 100
100 -
 101
101 -
 102
102 -
 103
103 -
 104
104 -
 105
105 -
 106
106 -
107
-
108
-
109
-
110
-
111
-
112
-
113
-
114
-
115
-
116
-
117
-
118
-
119
-
120
-
121
-
122
-
123
-
124
-
125
-
126
-
127
-
128
-
129
-
130
-
131
-
132
-
133
-
134
-
135
-
136
-
137
-
138
-
139
-
140
-
141
-
142
-
143
-
144
-
145
-
146
-
147
-
148
-
149
-
150
-
151
-
152
-
153
-
154
-
155
-
156
-
157
-
158
-
159
-
160
-
161
-
162
-
163
-
164
-
165
-
166
-
167
-
168
-
169
-
170
-
171
-
172
-
173
-
174
-
175
-
176
-
177
-
178
-
179
-
180
-
181
-
182
-
183
-
184
-
185
-
186
-
187
-
188
-
189
-
190
-
191
-
192
-
193
-
194
-
195
-
196
-
197
-
198
-
199
-
200
-
201
-
202
-
203
-
204
-
205
-
206
-
207
-
208
-
209
-
210
-
211
-
212
-
213
-
214
-
215
-
216
-
217
-
218
-
219
-
220
 |
 |

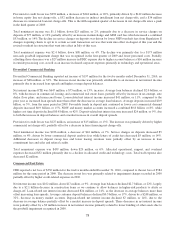
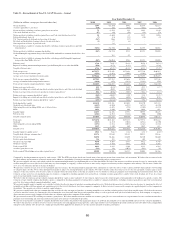
Total noninterest income was $521 million, down $165 million, or 24%. The decline was primarily due to lower production
income. Mortgage loan production income declined $251 million, or 69%, primarily due to lower loan production. Loan
originations were $29.3 billion in 2010, a 42% decrease from the prior year. Mortgage servicing income was up $66 million
driven by increased service fee income and improved MSR hedge performance, partially offset by the negative impact of
higher prepayments on MSR values. In 2010 all MSRs are recorded at fair value. Total loans serviced at December 31, 2010
were $167.2 billion compared with $178.9 billion at December 31, 2009, a 7% decline primarily due to the sale of MSRs on
residential loans with an unpaid principal balance of $7.0 billion.
Total noninterest expense declined $329 million, or 23%, primarily due to a $279 million non-cash goodwill impairment
charge recorded in first quarter of 2009. Total staff expense declined $75 million, or 16%, primarily due to lower
commission expense resulting from lower loan production. Captive reinsurance reserve expense also decreased $88 million
as a result of trust reserve limits being reached. These decreases were partially offset by a $46 million increase in higher
allocated credit and technology costs.
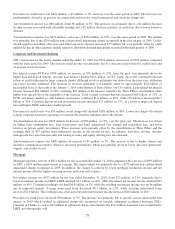
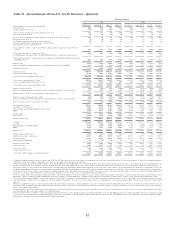
Wealth and Investment Management
W&IM’s net income for the twelve months ended December 31, 2010 was $180 million, an increase of $48 million, or 36%,
compared to the same period in 2009. The increase in net income was primarily due to increased net interest income and an
increase in noninterest income partially offset by an increase in compensation expense.
Net interest income was $447 million, an increase of $48 million, or 12%, driven mostly by deposit-related net interest
income. Average loan balances declined $0.2 billion, or 3% with decreases in commercial real estate, residential mortgages,
and direct installment loans, partially offset by increases in personal credit lines and home equity lines. Loan-related net
interest income increased $15 million, or 11%, as higher loan spreads more than offset the decrease in average loan balances.
Average customer deposits increased $0.6 billion, or 6%, as money market accounts increased $1.5 billion, or 55%.
Additionally, demand deposits increased $0.2 billion, or 9%, while time deposits decreased $0.6 billion, or 31%, and NOW
accounts decreased $0.4 billion, or 10%. Deposit-related net interest income increased $24 million, or 9%, due to the
combination of higher average balances and improved deposit spreads.
Provision for credit losses was $61 million, a decrease of $18 million, or 23%, due to decreased net charge-offs in both
consumer and commercial loan products.
Total noninterest income was $822 million, an increase of $69 million, or 9%. Trust income increased $17 million, or 3%,
primarily due to higher market valuations on managed equity assets and fixed income asset inflows partially offset by lower
MMMF revenue. Trading income increased $29 million due to higher valuations on trading assets and the sale of certain
previously acquired illiquid assets. Additionally, other income increased $25 million primarily due to an $18 million gain
from the transfer of the RidgeWorth Money Market Fund business to Federated Investors, Inc. These increases were partially
offset by a $9 million, or 5%, decline in retail investment income primarily driven by lower fixed annuity revenue.
As of December 31, 2010, assets under management were $105.1 billion compared to $119.5 billion as of December 31,
2009. Assets under management include individually managed assets, the RidgeWorth Funds, managed institutional assets,
and participant-directed retirement accounts. The decrease is attributable to $14.1 billion of money market mutual fund assets
that transferred to a third party during the second half of 2010. SunTrust’s total assets under advisement were $195.5 billion,
which includes $105.1 billion in assets under management, $46.0 billion in non-managed trust assets, $34.6 billion in retail
brokerage assets, and $9.8 billion in non-managed corporate trust assets.
Total noninterest expense was $916 million, an increase of $55 million, or 6%. The increase was primarily due to a $25
million, or 5%, increase in personnel related expense driven by incentive compensation associated with revenue growth.
Additional increases in discretionary and transactional structural expense were partially offset by decreased operating losses
and credit-related expense.
Corporate Other and Treasury
Corporate Other and Treasury’s net income for the twelve months ended December 31, 2010 was $444 million, an increase
of $47 million, or 12%, compared to the same period in 2009. The increase was primarily due to increased net interest
income and securities gains and a decrease in noninterest expense due to a special FDIC insurance assessment recorded in the
second quarter of 2009.
80