SunTrust 2010 Annual Report Download - page 107
Download and view the complete annual report
Please find page 107 of the 2010 SunTrust annual report below. You can navigate through the pages in the report by either clicking on the pages listed below, or by using the keyword search tool below to find specific information within the annual report.-
 1
1 -
2
-
3
-
4
-
5
-
6
-
7
-
8
-
9
-
10
-
11
-
12
-
13
-
14
-
15
-
16
-
17
-
18
-
19
-
20
-
21
-
22
-
23
-
24
-
25
-
26
-
27
-
28
-
29
-
30
-
31
-
32
-
33
-
34
-
35
-
36
-
37
-
38
-
39
-
40
-
41
-
42
-
43
-
44
-
45
-
46
-
47
-
48
-
49
-
50
-
51
-
52
-
53
-
54
-
55
-
56
-
57
-
58
-
59
-
60
-
61
-
62
-
63
-
64
-
65
-
66
-
67
-
68
-
69
-
70
-
71
-
72
-
73
-
74
-
75
-
76
-
77
-
78
-
79
-
80
-
81
-
82
-
83
-
84
-
85
-
86
-
87
-
88
-
89
-
90
-
91
-
92
-
93
-
94
-
95
-
96
-
 97
97 -
 98
98 -
 99
99 -
 100
100 -
 101
101 -
 102
102 -
 103
103 -
 104
104 -
 105
105 -
 106
106 -
 107
107 -
 108
108 -
 109
109 -
 110
110 -
 111
111 -
 112
112 -
 113
113 -
 114
114 -
 115
115 -
 116
116 -
 117
117 -
118
-
119
-
120
-
121
-
122
-
123
-
124
-
125
-
126
-
127
-
128
-
129
-
130
-
131
-
132
-
133
-
134
-
135
-
136
-
137
-
138
-
139
-
140
-
141
-
142
-
143
-
144
-
145
-
146
-
147
-
148
-
149
-
150
-
151
-
152
-
153
-
154
-
155
-
156
-
157
-
158
-
159
-
160
-
161
-
162
-
163
-
164
-
165
-
166
-
167
-
168
-
169
-
170
-
171
-
172
-
173
-
174
-
175
-
176
-
177
-
178
-
179
-
180
-
181
-
182
-
183
-
184
-
185
-
186
-
187
-
188
-
189
-
190
-
191
-
192
-
193
-
194
-
195
-
196
-
197
-
198
-
199
-
200
-
201
-
202
-
203
-
204
-
205
-
206
-
207
-
208
-
209
-
210
-
211
-
212
-
213
-
214
-
215
-
216
-
217
-
218
-
219
-
220
 |
 |

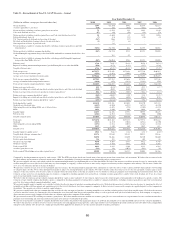
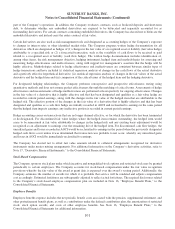
SUNTRUST BANKS, INC.
Consolidated Balance Sheets
As of
(Dollars in millions and shares in thousands)
December 31
2010
December 31
2009
Assets
Cash and due from banks $4,296 $6,456
Interest-bearing deposits in other banks 24 24
Funds sold and securities purchased under agreements to resell 1,058 517
Cash and cash equivalents 5,378 6,997
Trading assets 6,175 4,980
Securities available for sale 26,895 28,477
Loans held for sale 1(loans at fair value: $3,168 as of December 31, 2010; $2,923 as of
December 31, 2009) 3,501 4,670
Loans 2(loans at fair value: $492 as of December 31, 2010; $449 as of December 31, 2009) 115,975 113,675
Allowance for loan and lease losses (2,974) (3,120)
Net loans 113,001 110,555
Premises and equipment 1,620 1,552
Goodwill 6,323 6,319
Other intangible assets (MSRs at fair value: $1,439 as of December 31, 2010; $936 as of
December 31, 2009) 1,571 1,711
Customers’ acceptance liability 86
Other real estate owned 596 620
Other assets 7,806 8,278
Total assets $172,874 $174,165
Liabilities and Shareholders’ Equity
Noninterest-bearing consumer and commercial deposits $27,290 $24,244
Interest-bearing consumer and commercial deposits 92,735 92,059
Total consumer and commercial deposits 120,025 116,303
Brokered deposits (CDs at fair value: $1,213 as of December 31, 2010; $1,261 as of
December 31, 2009) 2,365 4,231
Foreign deposits 654 1,329
Total deposits 123,044 121,863
Funds purchased 951 1,433
Securities sold under agreements to repurchase 2,180 1,871
Other short-term borrowings 2,690 2,062
Long-term debt 3(debt at fair value: $2,837 as of December 31, 2010; $3,586 as of
December 31, 2009) 13,648 17,490
Acceptances outstanding 86
Trading liabilities 2,678 2,189
Other liabilities 4,545 4,720
Total liabilities 149,744 151,634
Preferred stock 4,942 4,917
Common stock, $1.00 par value 515 515
Additional paid in capital 8,403 8,521
Retained earnings 8,542 8,563
Treasury stock, at cost, and other (888) (1,055)
Accumulated other comprehensive income 1,616 1,070
Total shareholders’ equity 23,130 22,531
Total liabilities and shareholders’ equity $172,874 $174,165
Common shares outstanding 500,436 499,157
Common shares authorized 750,000 750,000
Preferred shares outstanding 50 50
Preferred shares authorized 50,000 50,000
Treasury shares of common stock 14,231 15,510
1Includes loans held for sale, at fair value, of consolidated VIEs $316 $-
2Includes loans of consolidated VIEs 2,869 -
3Includes debt of consolidated VIEs 764 -
See Notes to Consolidated Financial Statements.
91