SunTrust 2010 Annual Report Download - page 37
Download and view the complete annual report
Please find page 37 of the 2010 SunTrust annual report below. You can navigate through the pages in the report by either clicking on the pages listed below, or by using the keyword search tool below to find specific information within the annual report.-
 1
1 -
2
-
3
-
4
-
5
-
6
-
7
-
8
-
9
-
10
-
11
-
12
-
13
-
14
-
15
-
16
-
17
-
18
-
19
-
20
-
21
-
22
-
23
-
24
-
25
-
26
-
 27
27 -
 28
28 -
 29
29 -
 30
30 -
 31
31 -
 32
32 -
 33
33 -
 34
34 -
 35
35 -
 36
36 -
 37
37 -
 38
38 -
 39
39 -
 40
40 -
 41
41 -
 42
42 -
 43
43 -
 44
44 -
 45
45 -
 46
46 -
 47
47 -
48
-
49
-
50
-
51
-
52
-
53
-
54
-
55
-
56
-
57
-
58
-
59
-
60
-
61
-
62
-
63
-
64
-
65
-
66
-
67
-
68
-
69
-
70
-
71
-
72
-
73
-
74
-
75
-
76
-
77
-
78
-
79
-
80
-
81
-
82
-
83
-
84
-
85
-
86
-
87
-
88
-
89
-
90
-
91
-
92
-
93
-
94
-
95
-
96
-
97
-
98
-
99
-
100
-
101
-
102
-
103
-
104
-
105
-
106
-
107
-
108
-
109
-
110
-
111
-
112
-
113
-
114
-
115
-
116
-
117
-
118
-
119
-
120
-
121
-
122
-
123
-
124
-
125
-
126
-
127
-
128
-
129
-
130
-
131
-
132
-
133
-
134
-
135
-
136
-
137
-
138
-
139
-
140
-
141
-
142
-
143
-
144
-
145
-
146
-
147
-
148
-
149
-
150
-
151
-
152
-
153
-
154
-
155
-
156
-
157
-
158
-
159
-
160
-
161
-
162
-
163
-
164
-
165
-
166
-
167
-
168
-
169
-
170
-
171
-
172
-
173
-
174
-
175
-
176
-
177
-
178
-
179
-
180
-
181
-
182
-
183
-
184
-
185
-
186
-
187
-
188
-
189
-
190
-
191
-
192
-
193
-
194
-
195
-
196
-
197
-
198
-
199
-
200
-
201
-
202
-
203
-
204
-
205
-
206
-
207
-
208
-
209
-
210
-
211
-
212
-
213
-
214
-
215
-
216
-
217
-
218
-
219
-
220
 |
 |

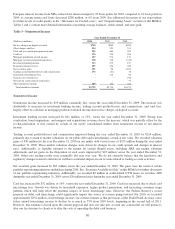
Item 6. SELECTED FINANCIAL DATA
Year Ended December 31
(Dollars in millions, except per share and other data) 2010 2009 2008 2007 2006
Summary of Operations
Interest income $6,343 $6,710 $8,328 $10,036 $9,792
Interest expense 1,489 2,244 3,708 5,316 5,132
Net interest income 4,854 4,466 4,620 4,720 4,660
Provision for credit losses32,651 4,064 2,474 665 262
Net interest income after provision for credit losses 2,203 402 2,146 4,055 4,398
Noninterest income 3,729 3,710 4,473 3,429 3,468
Noninterest expense 5,911 6,562 5,879 5,221 4,866
Income/(loss) before provision/(benefit) for income taxes 21 (2,450) 740 2,263 3,000
Net income attributable to noncontrolling interest 17 12 11 13 14
Provision/(benefit) for income taxes (185) (898) (67) 616 869
Net income/(loss) $189 ($1,564) $796 $1,634 $2,117
Net income/(loss) available to common shareholders ($87) ($1,733) $741 $1,593 $2,098
Net interest income-FTE1$4,970 $4,589 $4,737 $4,822 $4,748
Total revenue-FTE18,699 8,299 9,210 8,251 8,216
Total revenue-FTE excluding net securities (gains)/losses, net18,508 8,201 8,137 8,008 8,266
Net income/(loss) per average common share2
Diluted ($0.18) ($3.98) $2.12 $4.52 $5.78
Diluted excluding goodwill/intangible impairment charges, other than
MSRs1(0.18) (2.34) 2.19 4.39 5.77
Basic (0.18) (3.98) 2.12 4.56 5.84
Dividends paid per average common share 0.04 0.22 2.85 2.92 2.44
Book value per common share 36.34 35.29 48.74 50.72 49.12
Tangible book value per common share123.76 22.59 28.69 30.11 28.66
Market capitalization $14,768 $10,128 $10,472 $21,772 $29,972
Market price:
High 31.92 30.18 70.00 94.18 85.64
Low 20.16 6.00 19.75 60.02 69.68
Close 29.51 20.29 29.54 62.49 84.45
Selected Average Balances
Total assets $172,375 $175,442 $175,848 $177,796 $180,315
Earning assets 147,187 150,908 152,749 155,204 158,429
Loans 113,925 121,041 125,433 120,081 119,645
Consumer and commercial deposits 117,129 113,164 101,333 98,020 97,175
Brokered and foreign deposits 2,916 6,082 14,743 21,856 26,490
Total shareholders’ equity 22,834 22,286 18,596 17,928 17,698
Average common shares - diluted (thousands) 498,744 437,486 350,183 352,688 362,802
Average common shares - basic (thousands) 495,361 435,328 348,919 349,346 359,413
As of December 31
Total assets $172,874 $174,165 $189,138 $179,574 $182,162
Earning assets 148,473 147,896 156,017 154,397 159,064
Loans 115,975 113,675 126,998 122,319 121,454
Allowance for loan and lease losses 2,974 3,120 2,351 1,283 1,045
Consumer and commercial deposits 120,025 116,303 105,276 101,870 99,776
Brokered and foreign deposits 3,019 5,560 8,053 15,973 24,246
Long-term debt 13,648 17,490 26,812 22,957 18,993
Total shareholders’ equity 23,130 22,531 22,501 18,170 17,932
Financial Ratios and Other Data
Return on average total assets 0.11 % (0.89) % 0.45 % 0.92 % 1.17 %
Return on average total assets less net unrealized securities (gains)/
losses10.01 (0.96) 0.05 0.81 1.17
Return on average common shareholders’ equity (0.49) (10.07) 4.20 9.14 11.95
Return on average realized common shareholders’ equity 1(1.53) (11.12) 0.16 8.52 12.53
Net interest margin - FTE 3.38 3.04 3.10 3.11 3.00
Efficiency ratio - FTE 67.94 79.07 63.83 63.28 59.23
Tangible efficiency ratio167.36 69.35 62.51 62.11 57.97
Total average shareholders’ equity to total average assets 13.25 12.70 10.58 10.08 9.81
Tangible equity to tangible assets110.12 9.66 8.46 6.38 6.10
Effective tax rate (benefit)5NM (36.50) (9.23) 27.21 28.97
Allowance to year-end total loans 2.58 2.76 1.86 1.05 0.86
Total nonperforming assets to total loans plus
OREO and other repossessed assets 4.08 5.33 3.49 1.35 0.49
Common dividend payout ratio4N/A N/A 135.6 64.5 41.9
Capital Adequacy
Tier 1 common equity 8.08 % 7.67 % 5.83 % 5.27 % 5.66 %
Tier 1 capital 13.67 12.96 10.87 6.93 7.72
Total capital 16.54 16.43 14.04 10.30 11.11
Tier 1 leverage 10.94 10.90 10.45 6.90 7.23
1See Non-GAAP reconcilements in Tables 30 and 31 of the Management’s Discussion and Analysis of Financial Condition and Results of
Operations.
2Prior period amounts have been recalculated in accordance with updated accounting guidance related to earnings per share, that was effective
January 1, 2009 and required retrospective application.
3Beginning in the fourth quarter of 2009, SunTrust began recording the provision for unfunded commitments within the provision for credit
losses in the Consolidated Statements of Income/(Loss). Considering the immateriality of this provision, prior to the fourth quarter of 2009, the
provision for unfunded commitments remains classified within other noninterest expense in the Consolidated Statements of Income/(Loss).
4The common dividend payout ratio is not applicable in a period of net loss.
5The effective tax rate was not meaningful for the year ended December 31, 2010.
21