SunTrust 2010 Annual Report Download - page 61
Download and view the complete annual report
Please find page 61 of the 2010 SunTrust annual report below. You can navigate through the pages in the report by either clicking on the pages listed below, or by using the keyword search tool below to find specific information within the annual report.-
 1
1 -
2
-
3
-
4
-
5
-
6
-
7
-
8
-
9
-
10
-
11
-
12
-
13
-
14
-
15
-
16
-
17
-
18
-
19
-
20
-
21
-
22
-
23
-
24
-
25
-
26
-
27
-
28
-
29
-
30
-
31
-
32
-
33
-
34
-
35
-
36
-
37
-
38
-
39
-
40
-
41
-
42
-
43
-
44
-
45
-
46
-
47
-
48
-
49
-
50
-
 51
51 -
 52
52 -
 53
53 -
 54
54 -
 55
55 -
 56
56 -
 57
57 -
 58
58 -
 59
59 -
 60
60 -
 61
61 -
 62
62 -
 63
63 -
 64
64 -
 65
65 -
 66
66 -
 67
67 -
 68
68 -
 69
69 -
 70
70 -
 71
71 -
72
-
73
-
74
-
75
-
76
-
77
-
78
-
79
-
80
-
81
-
82
-
83
-
84
-
85
-
86
-
87
-
88
-
89
-
90
-
91
-
92
-
93
-
94
-
95
-
96
-
97
-
98
-
99
-
100
-
101
-
102
-
103
-
104
-
105
-
106
-
107
-
108
-
109
-
110
-
111
-
112
-
113
-
114
-
115
-
116
-
117
-
118
-
119
-
120
-
121
-
122
-
123
-
124
-
125
-
126
-
127
-
128
-
129
-
130
-
131
-
132
-
133
-
134
-
135
-
136
-
137
-
138
-
139
-
140
-
141
-
142
-
143
-
144
-
145
-
146
-
147
-
148
-
149
-
150
-
151
-
152
-
153
-
154
-
155
-
156
-
157
-
158
-
159
-
160
-
161
-
162
-
163
-
164
-
165
-
166
-
167
-
168
-
169
-
170
-
171
-
172
-
173
-
174
-
175
-
176
-
177
-
178
-
179
-
180
-
181
-
182
-
183
-
184
-
185
-
186
-
187
-
188
-
189
-
190
-
191
-
192
-
193
-
194
-
195
-
196
-
197
-
198
-
199
-
200
-
201
-
202
-
203
-
204
-
205
-
206
-
207
-
208
-
209
-
210
-
211
-
212
-
213
-
214
-
215
-
216
-
217
-
218
-
219
-
220
 |
 |

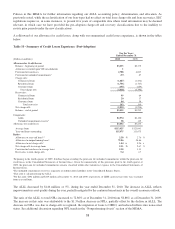
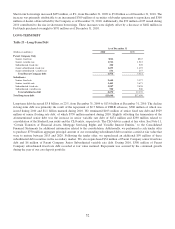
methods being offered to our residential clients are reductions in interest rates and extensions in terms. For commercial loans,
the primary restructuring method is the extensions of terms. Accruing loans with modifications deemed to be economic
concessions resulting from borrower difficulties are reported as TDRs. Nonaccruing loans that are modified and demonstrate
a history of repayment performance in accordance with their modified terms are reclassified to accruing restructured status,
typically after six months of repayment performance. See Note 1, “Significant Accounting Policies,” and Note 6, “Loans,” to
the Consolidated Financial Statements for further information regarding our accounting policy for TDRs.
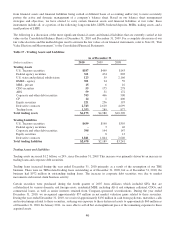
Accruing restructured loans increased by $972 million, or 59%, during the year ended December 31, 2010. The increase in
accruing restructured loans was attributed to a general increase in the number of loan modifications, as well as an increase in
the number of previously nonaccruing restructured loans meeting sustained repayment performance criteria and therefore
transferring to accrual status. Nonaccruing restructured loans increased by $92 million, or 10%, during the year ended
December 31, 2010, reflecting the overall increase in loan modifications despite such loans not yet meeting the repayment
performance criteria.
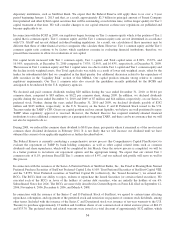
Interest income on restructured loans that have met sustained performance criteria and have been returned to accruing status
is recognized according to the terms of the restructuring. Such interest income recorded was $96 million and $52 million for
the years ended December 31, 2010 and 2009, respectively. If all such loans had been accruing interest according to their
original contractual terms, estimated interest income of $140 million and $75 million for the years ended December 31, 2010
and 2009, respectively, would have been recorded.
Our total TDR portfolio is composed of $3.2 billion in residential loans, which are predominately first and second lien
residential mortgages and home equity lines of credit, $437 million in commercial loans, which are predominately income-
producing properties, and $11 million in direct consumer loans. At December 31, 2010, 70% of our total TDR portfolio was
current with respect to principal and interest.
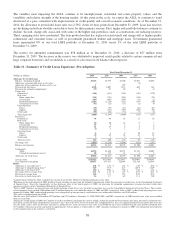
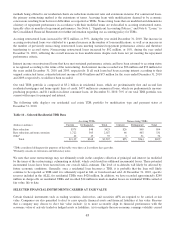
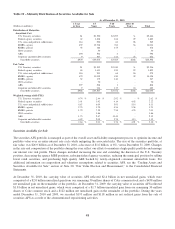
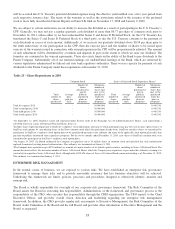
The following table displays our residential real estate TDR portfolio by modification type and payment status at
December 31, 2010.
Table 16 – Selected Residential TDR Data
Accruing TDRs Nonaccruing TDRs
(Dollars in millions) Current Delinquent1Total Current Delinquent1Total
Rate reduction $375 $48 $423 $26 $68 $94
Rate reduction and term extension 1,722 305 2,027 66 465 531
Other242 15 57 3 31 34
Total $2,139 $368 $2,507 $95 $564 $659
1TDRs considered delinquent for purposes of this table were those at least thirty days past due.
2Primarily consists of extensions and deficiency notes.
We note that some restructurings may not ultimately result in the complete collection of principal and interest (as modified
by the terms of the restructuring), culminating in default, which could result in additional incremental losses. These potential
incremental losses have been factored into our overall ALLL estimate. The level of re-defaults will likely be affected by
future economic conditions. Generally, once a residential loan becomes a TDR, it is probable that the loan will likely
continue to be reported as TDR until it is ultimately repaid in full, or foreclosed and sold. At December 31, 2010, specific
reserves included in the ALLL for residential TDRs were $428 million. In addition, we have recorded approximately $240
million in charge-offs on residential TDRs and recorded $14 million in mark-to-market losses on residential TDRs carried at
fair value, life to date.
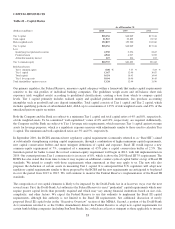
SELECTED FINANCIAL INSTRUMENTS CARRIED AT FAIR VALUE
Certain financial instruments such as trading securities, derivatives, and securities AFS are required to be carried at fair
value. Companies are also permitted to elect to carry specific financial assets and financial liabilities at fair value. Reasons
that a company may choose to elect fair value include: (i) to more accurately align its financial performance with the
economic value of actively traded or hedged assets or liabilities, (ii) to mitigate the non-economic earnings volatility caused
45