SunTrust 2010 Annual Report Download - page 55
Download and view the complete annual report
Please find page 55 of the 2010 SunTrust annual report below. You can navigate through the pages in the report by either clicking on the pages listed below, or by using the keyword search tool below to find specific information within the annual report.-
 1
1 -
2
-
3
-
4
-
5
-
6
-
7
-
8
-
9
-
10
-
11
-
12
-
13
-
14
-
15
-
16
-
17
-
18
-
19
-
20
-
21
-
22
-
23
-
24
-
25
-
26
-
27
-
28
-
29
-
30
-
31
-
32
-
33
-
34
-
35
-
36
-
37
-
38
-
39
-
40
-
41
-
42
-
43
-
44
-
 45
45 -
 46
46 -
 47
47 -
 48
48 -
 49
49 -
 50
50 -
 51
51 -
 52
52 -
 53
53 -
 54
54 -
 55
55 -
 56
56 -
 57
57 -
 58
58 -
 59
59 -
 60
60 -
 61
61 -
 62
62 -
 63
63 -
 64
64 -
 65
65 -
66
-
67
-
68
-
69
-
70
-
71
-
72
-
73
-
74
-
75
-
76
-
77
-
78
-
79
-
80
-
81
-
82
-
83
-
84
-
85
-
86
-
87
-
88
-
89
-
90
-
91
-
92
-
93
-
94
-
95
-
96
-
97
-
98
-
99
-
100
-
101
-
102
-
103
-
104
-
105
-
106
-
107
-
108
-
109
-
110
-
111
-
112
-
113
-
114
-
115
-
116
-
117
-
118
-
119
-
120
-
121
-
122
-
123
-
124
-
125
-
126
-
127
-
128
-
129
-
130
-
131
-
132
-
133
-
134
-
135
-
136
-
137
-
138
-
139
-
140
-
141
-
142
-
143
-
144
-
145
-
146
-
147
-
148
-
149
-
150
-
151
-
152
-
153
-
154
-
155
-
156
-
157
-
158
-
159
-
160
-
161
-
162
-
163
-
164
-
165
-
166
-
167
-
168
-
169
-
170
-
171
-
172
-
173
-
174
-
175
-
176
-
177
-
178
-
179
-
180
-
181
-
182
-
183
-
184
-
185
-
186
-
187
-
188
-
189
-
190
-
191
-
192
-
193
-
194
-
195
-
196
-
197
-
198
-
199
-
200
-
201
-
202
-
203
-
204
-
205
-
206
-
207
-
208
-
209
-
210
-
211
-
212
-
213
-
214
-
215
-
216
-
217
-
218
-
219
-
220
 |
 |

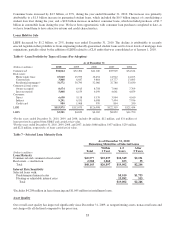
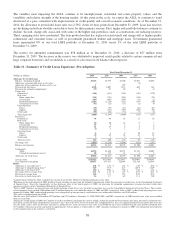
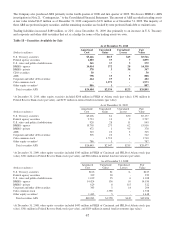
The variables most impacting the ALLL continue to be unemployment, residential real estate property values, and the
variability and relative strength of the housing market. At this point in the cycle, we expect the ALLL to continue to trend
downward at a pace consistent with improvements in credit quality and overall economic conditions. As of December 31,
2010, the allowance to period-end loans ratio was 2.58%, down 18 basis points from December 31, 2009. Loan loss reserves
are declining on both an absolute and relative basis for three primary reasons. First, higher risk portfolio balances continue to
decline. Second, charge-offs associated with some of the higher risk portfolios, such as construction, are reducing reserves.
Third, emerging risks have moderated. The loan production that has replaced recent runoff and charge-offs is higher quality
commercial and consumer loans, as well as government guaranteed student and mortgage loans. Government guaranteed
loans represented 8% of our total LHFI portfolio at December 31, 2010 versus 3% of the total LHFI portfolio at
December 31, 2009.
The reserve for unfunded commitments was $58 million as of December 31, 2010, a decrease of $57 million from
December 31, 2009. The decrease in the reserve was attributed to improved credit quality related to certain commercial and
large corporate borrowers and secondarily as a result of a decrease in off balance sheet exposure.
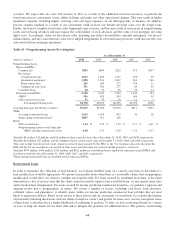
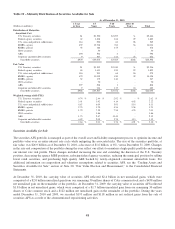
Table 11 - Summary of Credit Losses Experience (Pre-Adoption)
Year Ended December 31
(Dollars in millions) 2010 2009 2008 2007 2006
Allowance for Credit Losses
Balance - beginning of period $3,235 $2,379 $1,290 $1,047 $1,032
Allowance associated with loans at fair value1-- - (4) -
Allowance from acquisitions & other activity, net 1- 159 - -
Provision for loan losses 2,708 4,007 2,474 665 263
Provision for unfunded commitments2(57) 87 20 5 (1)
Charge-offs:
Commercial (386) (613) (219) (134) (179)
Real estate:
Home equity lines (591) (715) (449) (116) (29)
Construction (447) (507) (194) (12) (2)
Residential mortgages3(1,281) (1,236) (525) (113) (30)
Commercial real estate (92) (32) (25) (2) (8)
Consumer loans:
Direct (50) (57) (42) (24) (22)
Indirect (84) (152) (193) (107) (82)
Credit cards (87) (86) (33) (7) (5)
Total charge-offs (3,018) (3,398) (1,680) (515) (357)
Recoveries:
Commercial 46 40 24 23 29
Real estate:
Home equity lines 40 30 16 8 7
Construction 12 8312
Residential mortgages 21 18868
Commercial real estate (2) 4126
Consumer loans:
Direct 88 8 10 12
Indirect 33 49 54 41 45
Credit cards 53211
Total recoveries 163 160 116 92 110
Net charge-offs (2,855) (3,238) (1,564) (423) (247)
Balance-end of period $3,032 $3,235 $2,379 $1,290 $1,047
Components:
ALLL $2,974 $3,120 $2,351 $1,282 $1,045
Unfunded commitments reserve 58 115 28 8 2
Allowance for credit losses $3,032 $3,235 $2,379 $1,290 $1,047
Average loans $113,925 $121,041 $125,433 $120,081 $119,645
Year-end loans outstanding 115,975 113,675 126,998 122,319 121,454
Ratios:
Allowance to year-end loans4,5 2.58 % 2.76 % 1.86 % 1.05 % 0.86 %
Allowance to nonperforming loans4,6 72.9 58.9 61.7 101.9 216.9
Allowance to net charge-offs41.04 x 0.96 x 1.50 x 3.03 x 4.24 x
Net charge-offs to average loans 2.51 % 2.67 % 1.25 % 0.35 % 0.21 %
Provision to average loans 2.38 3.31 1.97 0.55 0.22
Recoveries to total charge-offs 5.4 4.7 6.9 17.8 31.0
1Amount removed from the ALLL related to our election to record $4.1 billion of residential mortgages at fair value.
2Beginning in the fourth quarter of 2009, SunTrust began recording the provision for unfunded commitments within the provision for credit losses in the Consolidated Statements
of Income/(Loss). Given the immateriality of this provision, prior to the fourth quarter of 2009, the provision for unfunded commitments remains classified within other
noninterest expense in the Consolidated Statements of Income/(Loss).
3Prior to 2009, borrower misrepresentation and denied insurance claim losses were recorded as operating losses in the Consolidated Statements of Income/(Loss). These credit-
related operating losses totaled $160 million and $78 million during the years ended December 31, 2008 and 2007, respectively. Prior to 2007, credit-related operating losses were
immaterial. During 2009, credit-related operating losses charged-off against previously established reserves within other liabilities total $195 million.
4This ratio is calculated using the ALLL.
5For this ratio, $492 million, $449 million, $270 million, and $221 million at December 31, 2010, 2009, 2008, and 2007, respectively, of LHFI carried at fair value were excluded
from year-end loans.
6During the second quarter of 2008, the Company revised its method of calculating this ratio to include, within the period-end loan amount, only loans measured at amortized cost.
Previously, period-end loans included loans measured at fair value or the lower of cost or market. The Company believes this is an improved method of calculation due to the fact
that the ALLL relates solely to the loans measured at amortized cost. Loans measured at fair value or LOCOM that have been excluded from the prior period calculation were
$172 million, which increased the calculation by approximately 12 basis points as of December 31, 2007. Amounts excluded in years prior to 2007 were immaterial and resulted in
no basis point change in the respective calculation.
39