SunTrust 2010 Annual Report Download - page 168
Download and view the complete annual report
Please find page 168 of the 2010 SunTrust annual report below. You can navigate through the pages in the report by either clicking on the pages listed below, or by using the keyword search tool below to find specific information within the annual report.-
 1
1 -
2
-
3
-
4
-
5
-
6
-
7
-
8
-
9
-
10
-
11
-
12
-
13
-
14
-
15
-
16
-
17
-
18
-
19
-
20
-
21
-
22
-
23
-
24
-
25
-
26
-
27
-
28
-
29
-
30
-
31
-
32
-
33
-
34
-
35
-
36
-
37
-
38
-
39
-
40
-
41
-
42
-
43
-
44
-
45
-
46
-
47
-
48
-
49
-
50
-
51
-
52
-
53
-
54
-
55
-
56
-
57
-
58
-
59
-
60
-
61
-
62
-
63
-
64
-
65
-
66
-
67
-
68
-
69
-
70
-
71
-
72
-
73
-
74
-
75
-
76
-
77
-
78
-
79
-
80
-
81
-
82
-
83
-
84
-
85
-
86
-
87
-
88
-
89
-
90
-
91
-
92
-
93
-
94
-
95
-
96
-
97
-
98
-
99
-
100
-
101
-
102
-
103
-
104
-
105
-
106
-
107
-
108
-
109
-
110
-
111
-
112
-
113
-
114
-
115
-
116
-
117
-
118
-
119
-
120
-
121
-
122
-
123
-
124
-
125
-
126
-
127
-
128
-
129
-
130
-
131
-
132
-
133
-
134
-
135
-
136
-
137
-
138
-
139
-
140
-
141
-
142
-
143
-
144
-
145
-
146
-
147
-
148
-
149
-
150
-
151
-
152
-
153
-
154
-
155
-
156
-
157
-
 158
158 -
 159
159 -
 160
160 -
 161
161 -
 162
162 -
 163
163 -
 164
164 -
 165
165 -
 166
166 -
 167
167 -
 168
168 -
 169
169 -
 170
170 -
 171
171 -
 172
172 -
 173
173 -
 174
174 -
 175
175 -
 176
176 -
 177
177 -
 178
178 -
179
-
180
-
181
-
182
-
183
-
184
-
185
-
186
-
187
-
188
-
189
-
190
-
191
-
192
-
193
-
194
-
195
-
196
-
197
-
198
-
199
-
200
-
201
-
202
-
203
-
204
-
205
-
206
-
207
-
208
-
209
-
210
-
211
-
212
-
213
-
214
-
215
-
216
-
217
-
218
-
219
-
220
 |
 |

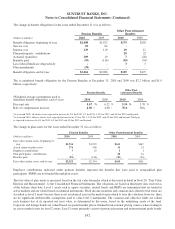
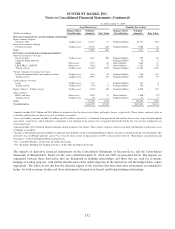
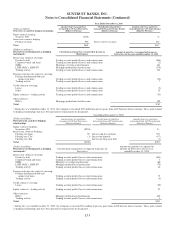
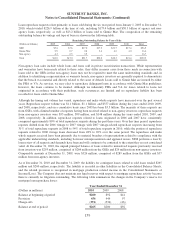
SUNTRUST BANKS, INC.
Notes to Consolidated Financial Statements (Continued)
As of December 31, 2009
Asset Derivatives Liability Derivatives
(Dollars in millions)
Balance Sheet
Classification
Notional
Amounts Fair Value
Balance Sheet
Classification
Notional
Amounts Fair Value
Derivatives designated in cash flow hedging relationships 5
Equity contracts hedging:
Securities AFS Trading assets $1,547 $- Trading liabilities $1,547 $46
Interest rate contracts hedging:
Floating rate loans Trading assets 15,550 865 Trading liabilities 3,000 22
Total 17,097 865 4,547 68
Derivatives not designated as hedging instruments 6
Interest rate contracts covering:
Fixed rate debt Trading assets 3,223 200 Trading liabilities 295 10
Corporate bonds and loans - - Trading liabilities 48 4
MSRs Other assets 3,715 62 Other liabilities 3,810 57
LHFS, IRLCs, LHFI-FV Other assets 7,462 375 Other liabilities 1,426 20
Trading activity Trading assets 94,140 13,290 Trading liabilities 83,483 3,243
Foreign exchange rate contracts covering:
Foreign-denominated debt and commercial loans Trading assets 1,164 96 Trading liabilities 656 144
Trading activity Trading assets 2,059 107 Trading liabilities 2,020 96
Credit contracts covering:
Loans Trading assets 115 1 Trading liabilities 241 4
Trading activity Trading assets 170 26 Trading liabilities 156 24
Equity contracts - Trading activity Trading assets 3,345 1446 Trading liabilities 6,908 672
Other contracts:
IRLCs and other Other assets 1,870 14 Other liabilities 1,560 449 4
Trading activity Trading assets 39 7 Trading liabilities 51 7
Total 117,302 4,304 100,654 4,310
Total derivatives $134,399 $5,169 $105,201 $4,378
1Amounts include $18.2 billion and $0.5 billion of notional related to interest rate futures and equity futures, respectively. These futures contracts settle in
cash daily and therefore no derivative asset or liability is recorded.
2Asset and liability amounts include $4 million and $9 million, respectively, of notional from purchased and written interest rate swap risk participation
agreements, respectively, which notional is calculated as the notional of the interest rate swap participated adjusted by the relevant risk weighted assets
conversion factor.
3Amount includes $2.0 billion of notional amounts related to interest rate futures. These futures contracts settle in cash daily and therefore no derivative asset
or liability is recorded.
4Includes a $40 million derivative liability recorded in other liabilities in the Consolidated Balance Sheets, related to a notional amount of $134 million. This
derivative was established upon the sale of Visa Class B shares in the second quarter of 2009 as discussed in Note 18, “Reinsurance Arrangements and
Guarantees,” to the Consolidated Financial Statements.
5See “Cash Flow Hedges” in this Note for further discussion.
6See “Economic Hedging and Trading Activities” in this Note for further discussion.
The impacts of derivative financial instruments on the Consolidated Statements of Income/(Loss) and the Consolidated
Statements of Shareholders’ Equity for the years ended December 31, 2010 and 2009 are presented below. The impacts are
segregated between those derivatives that are designated in hedging relationships and those that are used for economic
hedging or trading purposes, with further identification of the underlying risks in the derivatives and the hedged items, where
appropriate. The tables do not disclose the financial impact of the activities that these derivative instruments are intended to
hedge, for both economic hedges and those instruments designated in formal, qualifying hedging relationships.
152