SunTrust 2010 Annual Report Download - page 98
Download and view the complete annual report
Please find page 98 of the 2010 SunTrust annual report below. You can navigate through the pages in the report by either clicking on the pages listed below, or by using the keyword search tool below to find specific information within the annual report.-
 1
1 -
2
-
3
-
4
-
5
-
6
-
7
-
8
-
9
-
10
-
11
-
12
-
13
-
14
-
15
-
16
-
17
-
18
-
19
-
20
-
21
-
22
-
23
-
24
-
25
-
26
-
27
-
28
-
29
-
30
-
31
-
32
-
33
-
34
-
35
-
36
-
37
-
38
-
39
-
40
-
41
-
42
-
43
-
44
-
45
-
46
-
47
-
48
-
49
-
50
-
51
-
52
-
53
-
54
-
55
-
56
-
57
-
58
-
59
-
60
-
61
-
62
-
63
-
64
-
65
-
66
-
67
-
68
-
69
-
70
-
71
-
72
-
73
-
74
-
75
-
76
-
77
-
78
-
79
-
80
-
81
-
82
-
83
-
84
-
85
-
86
-
87
-
 88
88 -
 89
89 -
 90
90 -
 91
91 -
 92
92 -
 93
93 -
 94
94 -
 95
95 -
 96
96 -
 97
97 -
 98
98 -
 99
99 -
 100
100 -
 101
101 -
 102
102 -
 103
103 -
 104
104 -
 105
105 -
 106
106 -
 107
107 -
 108
108 -
109
-
110
-
111
-
112
-
113
-
114
-
115
-
116
-
117
-
118
-
119
-
120
-
121
-
122
-
123
-
124
-
125
-
126
-
127
-
128
-
129
-
130
-
131
-
132
-
133
-
134
-
135
-
136
-
137
-
138
-
139
-
140
-
141
-
142
-
143
-
144
-
145
-
146
-
147
-
148
-
149
-
150
-
151
-
152
-
153
-
154
-
155
-
156
-
157
-
158
-
159
-
160
-
161
-
162
-
163
-
164
-
165
-
166
-
167
-
168
-
169
-
170
-
171
-
172
-
173
-
174
-
175
-
176
-
177
-
178
-
179
-
180
-
181
-
182
-
183
-
184
-
185
-
186
-
187
-
188
-
189
-
190
-
191
-
192
-
193
-
194
-
195
-
196
-
197
-
198
-
199
-
200
-
201
-
202
-
203
-
204
-
205
-
206
-
207
-
208
-
209
-
210
-
211
-
212
-
213
-
214
-
215
-
216
-
217
-
218
-
219
-
220
 |
 |

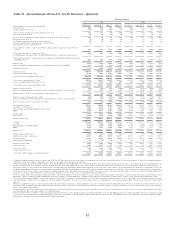
Net interest income-FTE was $572 million, a $38 million, or 7%, increase from the same period in 2008. Average loan balances
declined $0.7 billion, or 3%, with decreases in real estate construction loans, auto dealer floor plan loans and commercial and
industrial loans, partially offset by increases in commercial real estate loans, tax-exempt loans and nonaccrual loans. Loan-
related net interest income increased $20 million, or 6%, as increased loan spreads more than offset the decrease in average loan
balances. Average customer deposit balances increased $4.1 billion, or 31%, driven by a $1.9 billion, or 49%, increase in low
cost commercial demand deposits and NOW accounts, money markets accounts, and CDs increased a combined $2.3 billion, or
24%. Deposit related net interest income increased $43 million, or 19%, driven by balance growth and the deposit mix, partially
offset by the lower relative value of demand deposits. In addition, deposit sweep-related products, primarily repurchase
agreements, decreased $1.6 billion while the resulting net interest income decreased $18 million.
Provision for credit losses was $112 million, a $57 million increase over the same period in 2008 primarily due to an increase
in lease financing commercial real estate and commercial net charge-offs.
Total noninterest income was $242 million, a decline of $11 million, or 4%. The decrease was primarily due to $18 million
in equipment write downs on terminated leases and a $7 million decrease in internal sales referral credits. These decreases
were partially offset by a $5 million increase in operating lease revenue, a $5 million increase in letter of credit fees, a $3
million increase in service charges on deposit accounts and a $2 million increase in non-margin related loan fees.
Total noninterest expense was $468 million, an increase of $52 million, or 13%. FDIC insurance expense increased $39
million primarily due to increased deposit balances. Credit-related expense increased $37 million including operating losses,
collections services, other real estate expenses, and internal credit costs. Staff expenses decreased $9 million and internal
support and overhead allocated expenses decreased $11 million.
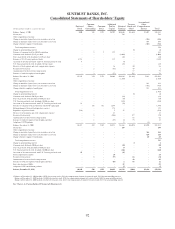
Commercial Real Estate
CRE reported a net loss of $584 million for the twelve months ended December 31, 2009, compared to net income of $28
million for the same period in 2008. The decrease in net income was primarily due to higher provision for credit losses,
higher credit-related noninterest expense, and a non-cash goodwill impairment charge in the first quarter of 2009.
Net interest income was $179 million, a decrease of $65 million, or 27%. Average loan balances declined $1.0 billion, or 7%,
with decreases in commercial real estate, commercial loans, and residential mortgages, partially offset by an increase in
nonaccrual loans. Loan-related net interest income declined $69 million, or 29%, primarily due to the decrease in accruing
loan balances and the increase in nonaccrual loans. Average customer deposits increased by $0.3 billion, or 16%, driven by
an increase in money market account average balances. Despite the year over year deposit growth, deposit-related net interest
income declined by $4 million, or 9%, resulting from the change in deposit mix as well as a decrease in the relative value of
demand deposits.
Provision for credit losses was $435 million, a $323 million increase over the same period in 2008. The increase was
predominantly driven by higher provision for real estate construction loans with smaller increases in mini-perms, residential
mortgages, and commercial loans.
Total noninterest income was $94 million, a $6 million, or 7%, increase driven by a $13 million increase in trading income
related to affordable housing properties partially offset by declines in partnership income and syndication fees.
Total noninterest expense was $721 million, an increase of $423 million. The increase was primarily driven by a non-cash
goodwill impairment charge of $299 million taken in the first quarter of 2009. Additionally, credit-related expense increased
by $117 million, partially offset by lower impairment charges related to affordable housing properties.
Corporate and Investment Banking
CIB’s net income for the twelve months ended December 31, 2009 was $116 million, a decrease of $26 million, or 18%,
compared to the same period in 2008. The decline was driven by an increase in provision for loan losses which was mostly
offset by strong growth in capital markets revenue.
Net interest income-FTE was $304 million, an increase of $34 million, or 13%, from the prior year primarily due to an
increase in loan spreads. Average loan balances decreased $0.5 billion, or 4%, while the loan-related net interest income
82