SunTrust 2010 Annual Report Download - page 84
Download and view the complete annual report
Please find page 84 of the 2010 SunTrust annual report below. You can navigate through the pages in the report by either clicking on the pages listed below, or by using the keyword search tool below to find specific information within the annual report.-
 1
1 -
2
-
3
-
4
-
5
-
6
-
7
-
8
-
9
-
10
-
11
-
12
-
13
-
14
-
15
-
16
-
17
-
18
-
19
-
20
-
21
-
22
-
23
-
24
-
25
-
26
-
27
-
28
-
29
-
30
-
31
-
32
-
33
-
34
-
35
-
36
-
37
-
38
-
39
-
40
-
41
-
42
-
43
-
44
-
45
-
46
-
47
-
48
-
49
-
50
-
51
-
52
-
53
-
54
-
55
-
56
-
57
-
58
-
59
-
60
-
61
-
62
-
63
-
64
-
65
-
66
-
67
-
68
-
69
-
70
-
71
-
72
-
73
-
 74
74 -
 75
75 -
 76
76 -
 77
77 -
 78
78 -
 79
79 -
 80
80 -
 81
81 -
 82
82 -
 83
83 -
 84
84 -
 85
85 -
 86
86 -
 87
87 -
 88
88 -
 89
89 -
 90
90 -
 91
91 -
 92
92 -
 93
93 -
 94
94 -
95
-
96
-
97
-
98
-
99
-
100
-
101
-
102
-
103
-
104
-
105
-
106
-
107
-
108
-
109
-
110
-
111
-
112
-
113
-
114
-
115
-
116
-
117
-
118
-
119
-
120
-
121
-
122
-
123
-
124
-
125
-
126
-
127
-
128
-
129
-
130
-
131
-
132
-
133
-
134
-
135
-
136
-
137
-
138
-
139
-
140
-
141
-
142
-
143
-
144
-
145
-
146
-
147
-
148
-
149
-
150
-
151
-
152
-
153
-
154
-
155
-
156
-
157
-
158
-
159
-
160
-
161
-
162
-
163
-
164
-
165
-
166
-
167
-
168
-
169
-
170
-
171
-
172
-
173
-
174
-
175
-
176
-
177
-
178
-
179
-
180
-
181
-
182
-
183
-
184
-
185
-
186
-
187
-
188
-
189
-
190
-
191
-
192
-
193
-
194
-
195
-
196
-
197
-
198
-
199
-
200
-
201
-
202
-
203
-
204
-
205
-
206
-
207
-
208
-
209
-
210
-
211
-
212
-
213
-
214
-
215
-
216
-
217
-
218
-
219
-
220
 |
 |

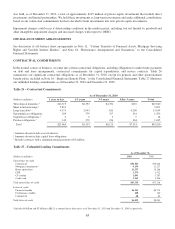
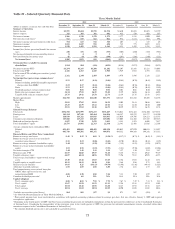
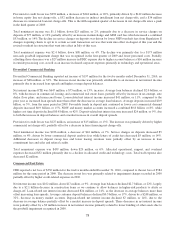
Table 28 – Level 3 Assets and Liabilities
As of December 31,
(Dollars in millions) 2010 2009
Trading assets $209 $390
Securities AFS 1,136 1,322
LHFS 7151
LHFI 492 449
Other intangible assets 11,439 936
Other assets 218 13
Total level 3 assets $3,301 $3,261
Total assets $172,874 $174,165
Total assets measured at fair value $38,410 $37,915
Level 3 assets as a percent of total assets 1.9 % 1.9 %
Level 3 assets as a percent of total assets measured at fair value 8.6 8.6
Long-term debt $- $-
Trading liabilities 145 46
Other liabilities 2,3 42 48
Total level 3 liabilities $187 $94
Total liabilities $149,744 $151,634
Total liabilities measured at fair value $6,842 $7,161
Level 3 liabilities as a percent of total liabilities 0.1 % 0.1 %
Level 3 liabilities as a percent of total liabilities measured at fair value 2.7 1.3
1MSRs carried at fair value.
2Includes IRLCs.
3Includes derivative related to sale of Visa shares during the second quarter of 2009.
Overall, the financial impact of the level 3 financial instruments did not have a significant impact on our liquidity or capital.
Some fair value assets are pledged for corporate borrowings or other liquidity purposes. Most of these arrangements provide
for advances to be made based on the market value and not the principal balance of the assets, and therefore whether or not
we have elected fair value accounting treatment does not impact our liquidity. If the fair value of assets posted as collateral
declines, we will be required to post more collateral under our borrowing arrangements which could negatively impact our
liquidity position on an overall basis. For purposes of computing regulatory capital, mark to market adjustments related to
our own creditworthiness for debt and index linked CDs accounted for at fair value are excluded from regulatory capital.
The following discussion provides further information on fair value accounting by balance sheet category including the
difficult to value assets and liabilities displayed in the table above.
Trading Assets and Liabilities and Securities AFS
In estimating the fair values for the majority of securities AFS and trading instruments, including residual and certain other retained
securitization interests, fair values are based on observable market prices of the same or similar instruments. We also gather third-
party broker quotes or use industry-standard or proprietary models to estimate the fair value of these instruments. For certain
securities and trading instruments, the distressed market conditions associated with this economic recession over the past few years
have impacted our ability to obtain market pricing data on certain portfolios of securities. Even when market pricing has been
available, the reduced trading activity resulting from current market conditions has challenged the observability of these quotations.
However, we have seen certain markets begin to recover and have also been able to liquidate many of our level 3 assets through
sales, maturities, or other distributions at prices approximating our previous estimates. When fair values are estimated based on
internal models, we will consider relevant market indices that correlate to the underlying collateral, along with assumptions such as
liquidity discounts, interest rates, prepayment speeds, default rates, loss severity rates, and discount rates.
Pricing services and broker quotes were obtained, when available, to assist in estimating the fair value of level 3 instruments.
We evaluate third party pricing to determine the reasonableness of the information relative to changes in market data such as
any recent trades we executed, market information received from outside market participants and analysts, and/or changes in
the underlying collateral performance. The number of quotes we obtained varied based on the number of brokers following a
particular security, but we generally attempt to obtain two to four quotes to determine reasonableness and comparability on a
relative basis. In most cases, the current market conditions caused the broker quotes to be indicative and the price indications
and broker quotes to be supported by very limited to no recent market activity. In those instances, we weighted the third party
information according to our judgment of it being a reasonable indication of the instrument’s fair value.
68