SunTrust 2010 Annual Report Download - page 115
Download and view the complete annual report
Please find page 115 of the 2010 SunTrust annual report below. You can navigate through the pages in the report by either clicking on the pages listed below, or by using the keyword search tool below to find specific information within the annual report.-
 1
1 -
2
-
3
-
4
-
5
-
6
-
7
-
8
-
9
-
10
-
11
-
12
-
13
-
14
-
15
-
16
-
17
-
18
-
19
-
20
-
21
-
22
-
23
-
24
-
25
-
26
-
27
-
28
-
29
-
30
-
31
-
32
-
33
-
34
-
35
-
36
-
37
-
38
-
39
-
40
-
41
-
42
-
43
-
44
-
45
-
46
-
47
-
48
-
49
-
50
-
51
-
52
-
53
-
54
-
55
-
56
-
57
-
58
-
59
-
60
-
61
-
62
-
63
-
64
-
65
-
66
-
67
-
68
-
69
-
70
-
71
-
72
-
73
-
74
-
75
-
76
-
77
-
78
-
79
-
80
-
81
-
82
-
83
-
84
-
85
-
86
-
87
-
88
-
89
-
90
-
91
-
92
-
93
-
94
-
95
-
96
-
97
-
98
-
99
-
100
-
101
-
102
-
103
-
104
-
 105
105 -
 106
106 -
 107
107 -
 108
108 -
 109
109 -
 110
110 -
 111
111 -
 112
112 -
 113
113 -
 114
114 -
 115
115 -
 116
116 -
 117
117 -
 118
118 -
 119
119 -
 120
120 -
 121
121 -
 122
122 -
 123
123 -
 124
124 -
 125
125 -
126
-
127
-
128
-
129
-
130
-
131
-
132
-
133
-
134
-
135
-
136
-
137
-
138
-
139
-
140
-
141
-
142
-
143
-
144
-
145
-
146
-
147
-
148
-
149
-
150
-
151
-
152
-
153
-
154
-
155
-
156
-
157
-
158
-
159
-
160
-
161
-
162
-
163
-
164
-
165
-
166
-
167
-
168
-
169
-
170
-
171
-
172
-
173
-
174
-
175
-
176
-
177
-
178
-
179
-
180
-
181
-
182
-
183
-
184
-
185
-
186
-
187
-
188
-
189
-
190
-
191
-
192
-
193
-
194
-
195
-
196
-
197
-
198
-
199
-
200
-
201
-
202
-
203
-
204
-
205
-
206
-
207
-
208
-
209
-
210
-
211
-
212
-
213
-
214
-
215
-
216
-
217
-
218
-
219
-
220
 |
 |
SUNTRUST BANKS, INC.
Notes to Consolidated Financial Statements (Continued)
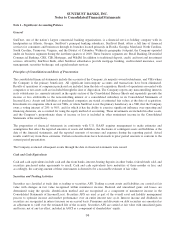
The Company previously maintained two classes of MSRs. MSRs related to loans sold before January 1, 2008 were
accounted for at amortized cost, net of any allowance for impairment losses. Beginning January 1, 2009, MSRs related to
loans originated and sold after January 1, 2008 were accounted for at fair value. Effective January 1, 2010, the Company
elected to record the MSRs previously carried at LOCOM at fair value. See Note 9, “Goodwill and Other Intangible Assets,”
to the Consolidated Financial Statements for further discussion regarding this election. Historically, the Company had not
directly hedged its MSRs accounted for at amortized cost, but had managed the economic risk through the Company’s
overall asset/liability management process with consideration to the natural counter-cyclicality of servicing value and
mortgage production. Effective January 1, 2009, when the Company created the class of MSRs accounted for at fair value,
the Company began to actively hedge this class of MSRs.
MSRs, carried at LOCOM, were amortized over the period of the estimated future net servicing cash flows. The projected
future cash flows were derived from the same model and assumptions used to estimate the fair value of MSRs. When fair
value was less than amortized cost, and the impairment was believed to be temporary, the impairment was recorded to a
valuation allowance through mortgage servicing income in the Consolidated Statements of Income/(Loss).
The fair values of MSRs are determined by projecting net servicing cash flows, which are then discounted to estimate the fair
value. The fair values of MSRs are impacted by a variety of factors, including prepayment assumptions, discount rates,
delinquency rates, contractually specified servicing fees, servicing costs and underlying portfolio characteristics. The
underlying assumptions and estimated values are corroborated by values received from independent third parties. The
carrying value of MSRs is reported on the Consolidated Balance Sheets in other intangible assets. Servicing fees are
recognized as they are received and changes in fair value are also reported in mortgage servicing related income in the
Consolidated Statements of Income/(Loss). For additional information on the Company’s servicing fees, refer to Note 11,
“Certain Transfers of Financial Assets, Mortgage Servicing Rights and Variable Interest Entities,” to the Consolidated
Financial Statements.
Other Real Estate Owned
Assets acquired through, or in lieu of loan foreclosure are held for sale and are initially recorded at the lower of the loan’s cost
basis or the asset’s fair value at the date of foreclosure, less estimated selling costs. To the extent fair value, less cost to sell, is
less than the loan’s cost basis, the difference is charged to the ALLL at the date of transfer into OREO. We estimate market
values primarily based on appraisals and other market information. Subsequent changes in value of the assets are reported as
adjustments to the asset’s carrying amount. Subsequent to foreclosure, changes in value along with gains or losses from the
disposition on these assets are reported in noninterest expense in the Consolidated Statements of Income/(Loss).
Loan Sales and Securitizations
The Company sells and at times may securitize loans and other financial assets. When the Company securitizes assets, it may
hold a portion of the securities issued, including senior interests, subordinated and other residual interests, interest-only strips,
and principal-only strips, all of which are considered retained interests in the transferred assets. Previously when the Company
retained securitized interests, the cost basis of the securitized financial assets were allocated between the sold and retained
portions based on their relative fair values. The gain or loss on sale was then calculated based on the difference between
proceeds received, which includes cash proceeds and the fair value of MSRs, if any, and the cost basis allocated to the sold
interests. The retained interests were subsequently carried at fair value. Beginning January 1, 2010, retained securitized interests
are recognized and initially measured at fair value in accordance with the updated transfers and servicing accounting guidance.
The interests in securitized assets held by the Company are typically classified as either securities AFS or trading assets and
carried at fair value, which is based on independent, third-party market prices, market prices for similar assets, or discounted
cash flow analyses. If market prices are not available, fair value is calculated using management’s best estimates of key
assumptions, including credit losses, loan repayment speeds and discount rates commensurate with the risks involved.
Unrealized gains and losses on retained interests classified as AFS are shown, net of any tax effect, in AOCI as a component of
shareholders’ equity. Realized gains and losses on AFS or trading securities and unrealized gains and losses on trading securities
are recorded in noninterest income in the Consolidated Statements of Income/(Loss). For additional information on the
Company’s securitization activities, refer to Note 11, “Certain Transfers of Financial Assets, Mortgage Servicing Rights and
Variable Interest Entities,” to the Consolidated Financial Statements.
99